How to Make a Cohort Analysis Chart in PowerPoint
Cohort Analysis it’s a time-tested segmentation technique used to understand user behavior and recently adopted by authors of Customer Development and Lean Startup methodologies. In Running Lean and Lean Analytics books there are mentions to cohort analysis since this segmentation technique can help entrepreneurs to understand the behavior of early adopters of your product or startup and learn more about their behavior using your product. If you have financial or medical background then this segmentation technique may be more familiar to you, but it is true that more recently it’s become a very popular way of measuring customer loyalty.
If you need to create PowerPoint presentations with cohort charts & tables and charts for example to get funds or seed your project, then this technique can help you to prepare Cohort Analysis presentation to investors.
First time we learned about QuickCohort was on this post How to get data for Cohort Chart, which explains very well how to query your data using SQL to prepare a simple but effective Cohort Chart.
Related: Don’t forget to check the Business Templates for Entrepreneurs and Startups.
There are multiple ways to gather your data needed for a cohort chart, for example Analytics Talk shows a method to query the data for a Cohort Analysis from Google Analytics, a common analytics tool present in a huge percentage of online businesses, so if your startup is an online business maybe you already are using Google Analytics or other tools like MixPanel or KissMetrics.
How to Make a Cohort Chart for PowerPoint Presentation
Now, here is the method to make a cohort chart ready for PowerPoint presentations using free tools.
First, you need to get the data required for the cohort analysis. From the previous link above in this article you can learn how to extract your data from your database if you have events recorded, the initial date and the event date. You can get the count of every event that you need to put in your cohort analysis.
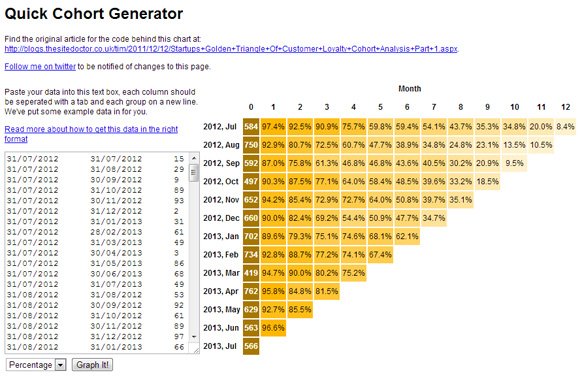
Then, you can use Quick Cohort Generator tool from QuickCohort.com to generate a chart. The output will be as a pure HTML table.
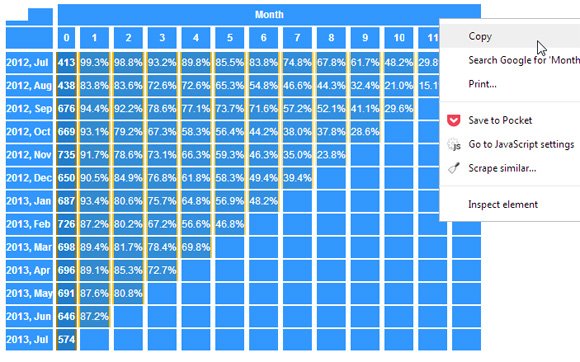
Then, the magic here is to copy the HTML table and paste it in PowerPoint. Make sure to select all the cells from the table (you can start from the top left corner of the table and select everything until reaching the bottom right corner. Notice the cohort chart produces a triangle, but the HTML table is a rectangle with empty cells, so make sure to select the whole table.
Tip: If you are using Google Analytics to get your data, then you can use the Custom Variables to Create Cohorts. For example, the general idea is that you set a visitor level custom variable with the date of the action when the user completes the action. Another option is to use Events. There is a Remarketing feature and tool in Google Analytics that supports you to create user segmentation analysis and it seems to be the future of segmentation under Google Analytics.
Now, go to your PowerPoint presentation and choose the slide where you want to paste the cohort analysis chart. Here you can paste the HTML table.
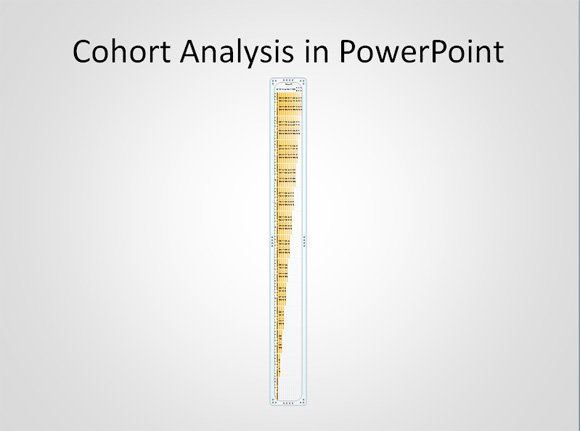
The first time we pasted the HTML table in PowerPoint it was too thin. However, you can easily adjust the table size in PowerPoint so enlarge it by dragging the edge of the table or changing the size properties.
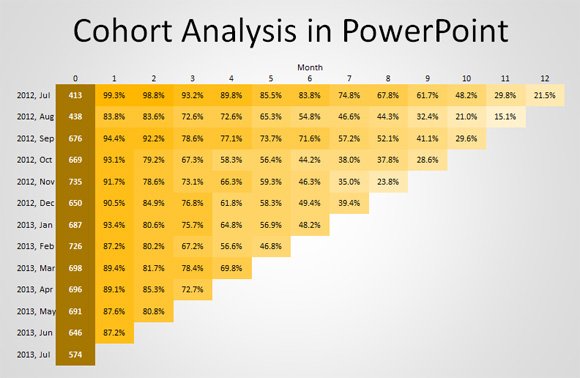
You will need to increase the default font size, otherwise the font used by default can be very small. Here is the resulting table after we adjusted the table and increasing the font size.
With a few simple steps we got a very nice Cohort Chart ready to be used in our presentations. Clearly the hard challenge here is to prepare your system to get the data table required to make this chart, but as you can see you only need to keep track of 3 variables: the initial date, the event date and the count.
Finally, if you want to see a real example you can download this free Cohort Analysis template for PowerPoint with the table and data we used to create the figures above.
Cohort Analysis PowerPoint Template (1486 downloads )