Using Chart Layouts to Enhance your Charts in PowerPoint
Last updated on September 3rd, 2024
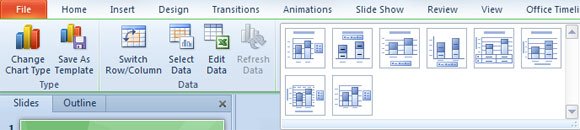
Chart layouts in PowerPoint can be used to enhance your presentation charts. Chart layout is a menu under Chart Tools that is visible when you open or select a chart in the slide. From this menu you can control how the chart layout will be displayed on the screen and you can definitely use this tool to change your chart options easily.
Using Chart Layouts to Enhance your Charts in PowerPoint
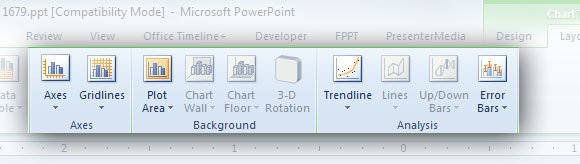
Select a chart and then look for Layout menu. You will see different sections including Axes, Background and Analysis options.
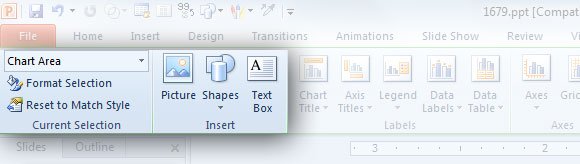
Additionally, on the left of this menu you can control what to display on the Chart Area and format a selection. You can also insert pictures, shapes and textbox inside the chart area, which is pretty good option to decorate your charts with rich information.
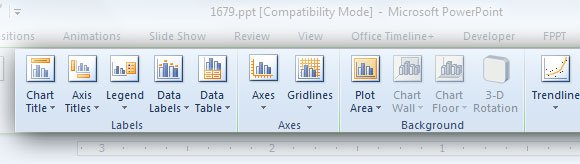
The Labels section let you control where to display the chart title, the axis titles and legend in the chart. You can control how to display the data labels and insert the data table below the chart.
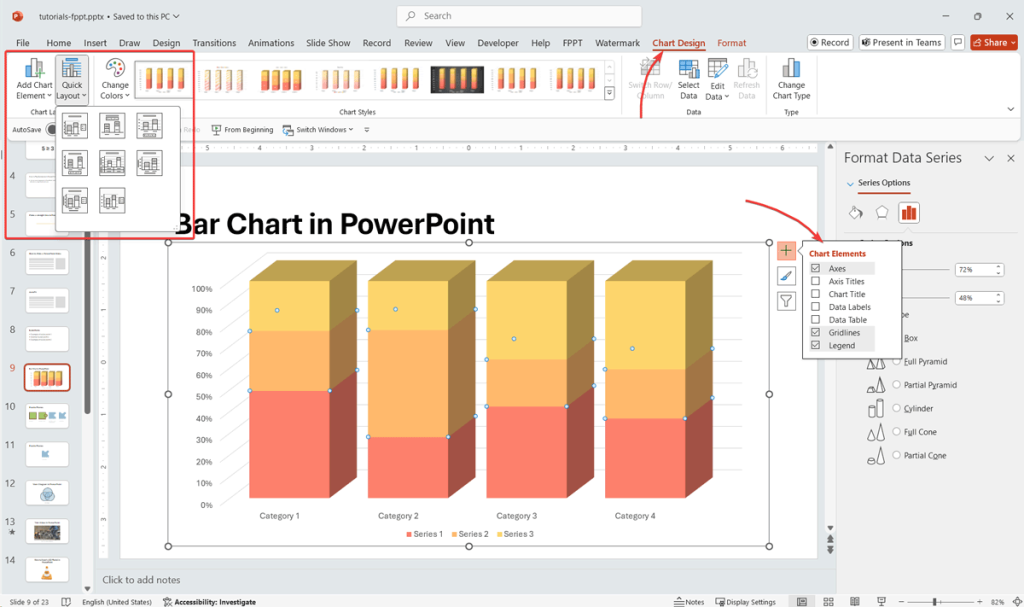
Inside Chart Layouts section you can choose from different chart layout preset, for example to display legend below the chart, display a chart table, display or not the axis labels, etc.
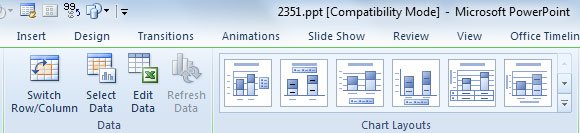
You can open this chart layout menu to choose the layout that best fulfill your needs.
Using chart layouts and options gives you more flexibility on the PowerPoint chart design. You can use the chart options to make awesome Chart graphics for PowerPoint presentations and decorate your business or financial slides.