Treemap Visualization: Quick Guide to Visualizing Hierarchical Data
Last updated on October 3rd, 2024
A treemap is a powerful visualization tool that helps present hierarchical data through nested rectangles. Each rectangle represents a category or subcategory within the hierarchy, and its size is proportional to a specific numerical value, such as sales figures or file sizes. Treemaps are especially effective for comparing the sizes of different categories, and they often use color to add an additional dimension to the data, such as performance or classification. This makes treemaps a great choice for quickly analyzing complex data structures.
If your data is a hierarchy, a treemap is an excellent way to show all the values and keep the structure in the visual. This is a quick way to make a treemap in R.
If you need to create Treemap in Excel, Databison has a great (but not free) Treemap add-in for Excel that you can install that will help to make Treemaps in the spreadsheet. Once you have the graphics rendered in Excel you can export to image or copy and paste in your PowerPoint presentation.
Treemaps can also be used to represent complex data and hierarchies, for more info you can refer to Treemaps for space-constrained visualization of hierarchies.

Treemap Examples
Treemaps are commonly used in:
- Sales Analysis: Visualize the sales performance of various product categories, where each rectangle represents a category, and its size corresponds to the sales volume.
- File System Visualization: Represent the space used by files and folders on a hard drive, where the size of each rectangle corresponds to the storage size of that folder or file.
- Budget Allocation: Visualize how funds are distributed across departments, projects, or expenses in a budget.
- Stock Market Analysis: Display the market capitalization of companies, with color indicating stock performance.
To learn more about treemaps, here are some treemap visualization examples that you may find useful for inspiration and for understanding the idea of treemaps as a powerful visualization tool.

Here is another creative example of treemap visualization based on the Obama 2011 Budget Proposal: How it is Spent.

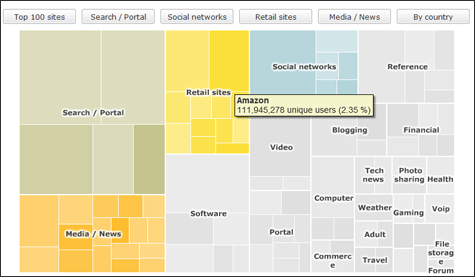
News and press coverage (Newsmap example)

BBC News for top 100 websites
In the stock market you can also find some good examples using Treemap. Here is another example of treemap visualization for stock market.

Treemap Tools
There are plenty of tools to create treemaps, and while Treemap graphics are not built-in in PowerPoint, you can still create treemap visualizations for your presentations using any of the available tools, or even Microsoft Excel.
There are several tools available for creating treemaps, ranging from built-in options in common software to advanced programming libraries:
- Microsoft Excel: Excel has built-in support for treemaps. To create one, enter your data and use the “Treemap Chart” option under the “Insert” tab.
- R Programming: Use the
treemappackage in R to create custom treemaps from your own data. This tutorial from FlowingData walks through the steps. - Google Visualization API: Google offers a free API to create interactive treemaps, suitable for web-based visualizations.
- Power BI: This tool integrates treemaps into dynamic dashboards, allowing you to explore and interact with your data.
- A web treemap can be created using JavaScript and Open Source tools like this webtreemap (demo) or JS treemap.
- SlideModel presents a way to make treemaps for PowerPoint presentations with additional tools and resources (you can also download treemap PPT templates).
Conclusion
In conclusion, treemaps are a highly effective way to visualize hierarchical data, making it easy to compare proportions and identify trends. Whether you’re analyzing sales data, managing a file system, or exploring stock market performance, treemaps can offer valuable insights in a visually compelling way.