
Advertisement
Customer Profitability Analysis Template for Excel
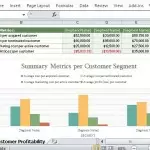
Customer profitability is the profit that a company makes in serving a particular customer or client over a specific timeframe. This is the difference between the customer revenue and the costs of having business relationships with a specific customer.