Problem Analysis With Pareto Chart Template For Excel
It is inevitable for problems to arise in any situation, whether at work, in business, or in your personal life. With every problem, there is always a solution. The only challenge left to do it to find which solution is best. In a professional setting, problem analysis is usually done to manage problems and come up with solutions.
A problem analysis is a system for dissecting and understanding a problem–it’s cause, how it grew, and its effects. At times, creating a problem analysis can be a problem in itself so you need a reliable template to use. The Problem Analysis with Pareto Chart Template for Excel is a wonderful tool to help you analyze your problem and present it in a visual manner.
Problem Analysis is No Problem
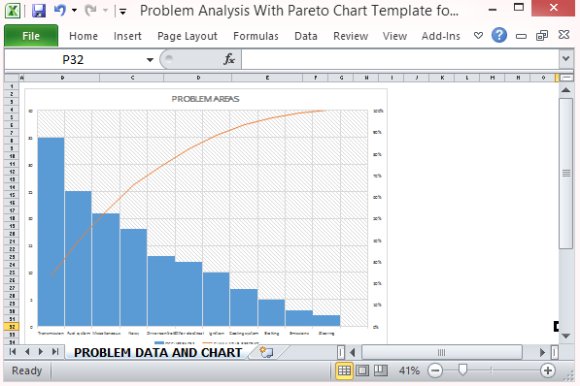
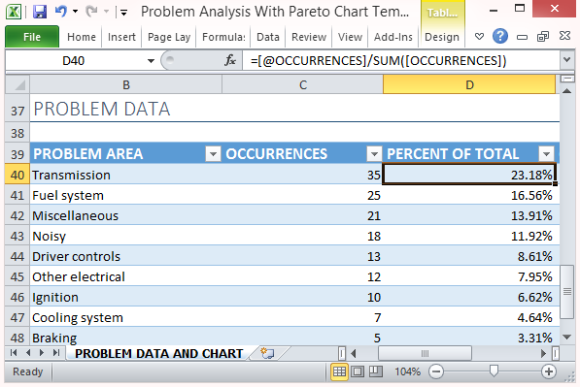
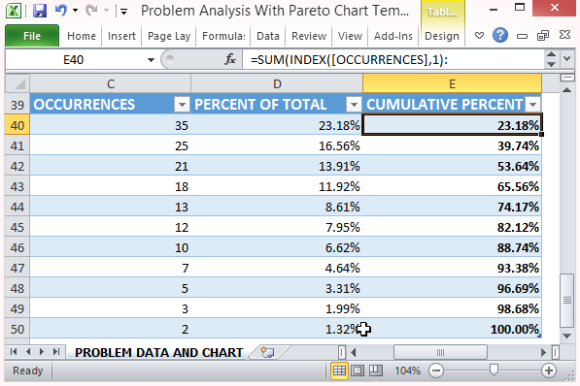
With the Problem Analysis With Pareto Chart Template for Excel, you can just input issues or problems and their occurrences. The template automatically computes for the percentage of the occurrences, and their cumulative total percentages. These are then translated automatically into a bar chart showing the descending order of occurrence.
This Excel template is free to use and makes an otherwise complicated task far less daunting. This template is useful for quality control monitoring and for managing problems at work, specifically in operations.
A problem analysis is essential in helping you not only solve a problem but also in preventing it from happening again. You can easily pinpoint the problem areas and those that have the most impact so you can create proper measures to address them.
Pareto Chart
A Pareto Chart is a bar graph that represents a frequency or cost and arranges them with longer bars on the left and the shortest to the right, depicting the significance of the situation presented.
The Pareto Chart is the perfect chart to go with problem analysis tables because anyone involved in quality control or in making critical decisions for the company or organization can easily see, at a glance, which problem creates the most impact and therefore do something about it.
The Pareto Chart can also be embedded or inserted in a PowerPoint presentation for any reports that you may need to have in slides.
Go to Download Problem Analysis With Pareto Chart Template for Excel