Editable PowerPoint Dashboard Toolkit for Presentations
If you need to create a Dashboard in PowerPoint, then this dashboard template toolkit provided by PresenterMedia can be very useful and practical for your business needs.

Dashboard Template for PowerPoint Toolkit is a well-designed and professional-looking Dashboard template that you can download if you have a subscription to PresenterMedia.
The dashboard template toolkit for PowerPoint contains everything you need to make awesome dashboards in PowerPoint for your business or corporate use. For example, you can use it as part of the new corporate strategy or to show the key indicators and monitor your business performance since the template contains gauges and thermometers that you can use.
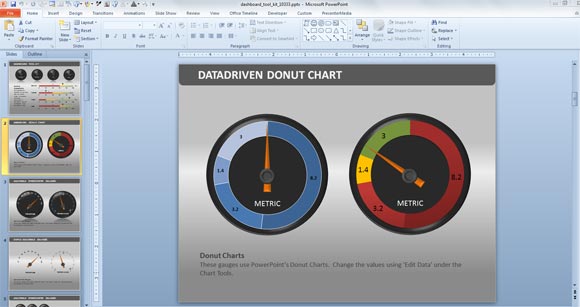
You can find data-driven donut charts with a nice look that are great to show as a performance indicator. Easily, you can edit the data inside this donut chart because it uses a simple doughnut chart in PowerPoint. You can change the values by using the Edit Data option under Chart Tools, making it easier to create dashboard presentations in PowerPoint.

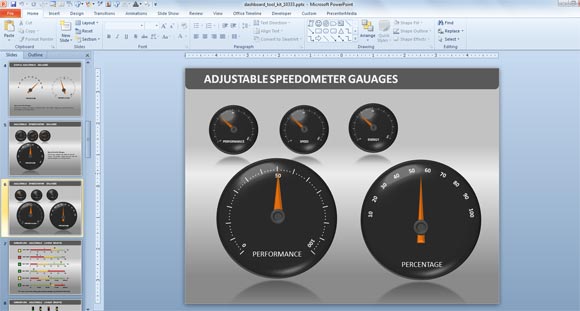
Alternatively you can also use adjustable speedometer gauges with a realistic design (like the speedometers used in classic cars).

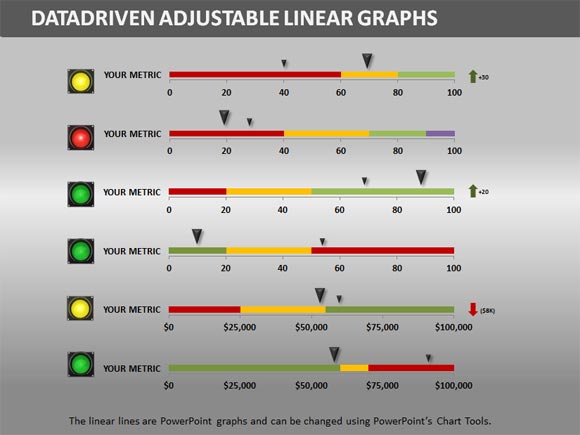
Additionally you can access many other slides with gauges and thermometers and other charts that you can use in a dashboard, for example the data-driven adjustable linear graphs using a kind of traffic light indicator with a linear graph featuring red, yellow and green colors to measure your metric.

The dashboard PPT template toolkit is provided as a PowerPoint presentation that contains multipel slides with dashboard layouts and it is compatible with PowerPoint and Google Slides. You can use the dashboard PPT template to evaluate different metrics as part of a project management presentation or use gauges to measure your metrics in PowerPoint presentations.
Unless you need a simple free dashboard PowerPoint template you can use this premium template offered by PresenterMedia to create awesome dashboards in PowerPoint. Alternatively, you can check out our best dashboard templates for PowerPoint and Google Slides presentations.
