How to Make a Control Chart in PowerPoint
Last updated on November 26th, 2024
Control charts are widely used in statistical quality control presentations, and it is a kind of individual or moving-range chart that you can use to monitor variables data from a business or industrial process for which it is impractical to use rational subgroups.
You can use control charts to monitor data. Other control charts are also known as Shewhart charts, process-behavior charts, or sigma zones process control charts.
In this article, we will show you how to make a simple control chart in PowerPoint for your presentations using basic PowerPoint charts.
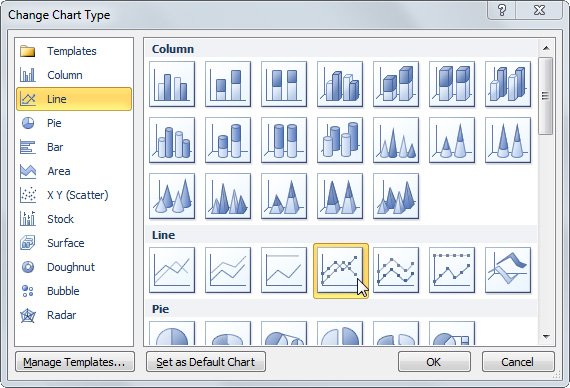
To create a simple control chart in PowerPoint you can use the
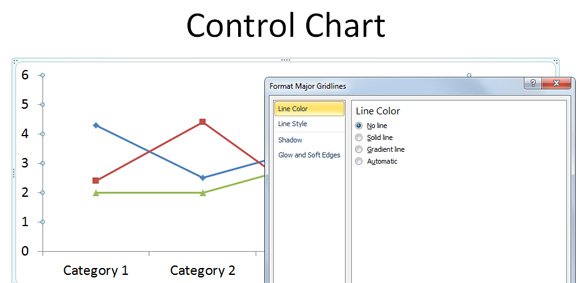
Then, remove the background lines so the control chart looks more neat and clear.
Now, you can add the control lines to the chart. Simply insert an horizontal line in PowerPoint using shapes.
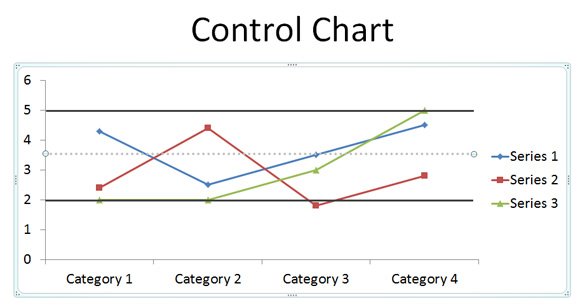
Make sure you enter the line inside the chart area. You can hold the Alt key to move the lines to any desired location and this will override the grid settings.
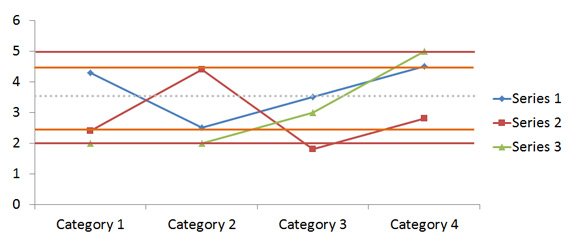
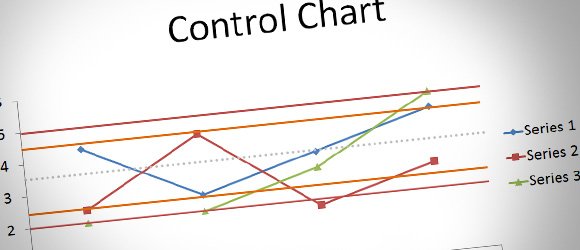
If you need to define multiple zone rules, then you can use the same approach to create multiple control lines.
The Western Electric Rules are decision rules for detecting “out-of-control” or non-random conditions on control charts and it is also used in the field of Statistical Process Control.
You can copy the lines you have added before and then change the color for the top and bottom bands. You can use a red color and then an orange color to differentiate the limits of the control.