How to Embed Dashboards from Tableau Software in PowerPoint Presentations
Tableau Software is a free business intelligence and analytics software that you can use to make awesome dashboards and reports for your company and products. By using this powerful tool you can create catchy and accurate dashboards.
On the other side, PowerPoint is a tool that we can use to make corporate presentations and show dashboards in a meeting. Moreover, playing the slideshow in a web meeting we can show the top indicators and business performance to the CEOs and global managers.
You can embed Tableau Dashboards in a PowerPoint presentation using a simple method. For this guide, we will use Live Web addin for PowerPoint, it is a very basic addin that lets us add a live web page in our PowerPoint slide.
Using this addin, plus the capabilities offered by Tableau Software to publish the dashboard online (you can use either a public registration or the Tableau Server platform if it is available in your organization).
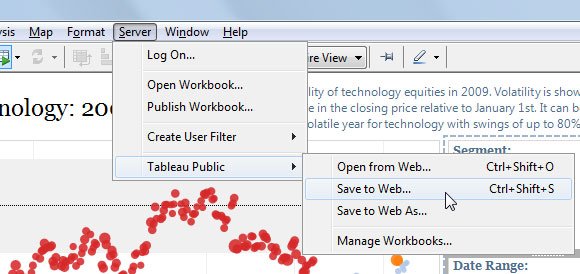
From Tableau Desktop, you will need to go to Server -> Tableau Public and then Save to Web… If you don’t have an account, you can create one for free for the public area, however you are only allowed to use projects with less than 10.000 rows of data.
Now, once you have exported the data to the public profile, you will get a link or URL to the public page. So, now it is time for PowerPoint to show the live dashboard.
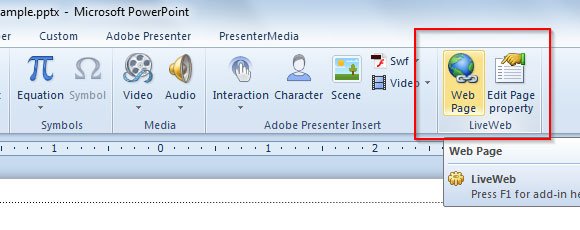
In order to show the dashboard from a web page in PowerPoint you will need to install LiveWeb PowerPoint add-in. Or you can use advanced controls and add an Internet Explorer object inside the slide. However, LiveWeb makes this job much easier.
Once installed, add a new web page and specify the location URL of the public dashboard that you want to embed (alternatively you can download PowerPoint dashboard template for presentations).
Now, you are ready to insert the URL and make the awesome presentations with real and live dashboards from Tableau.
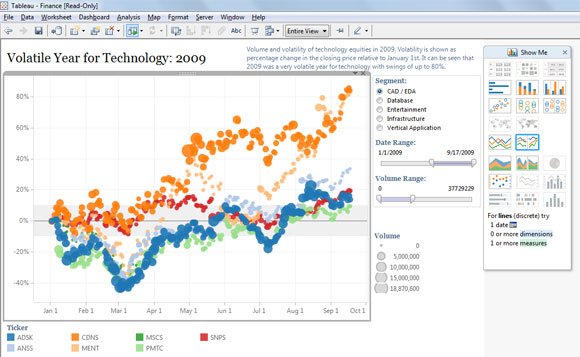
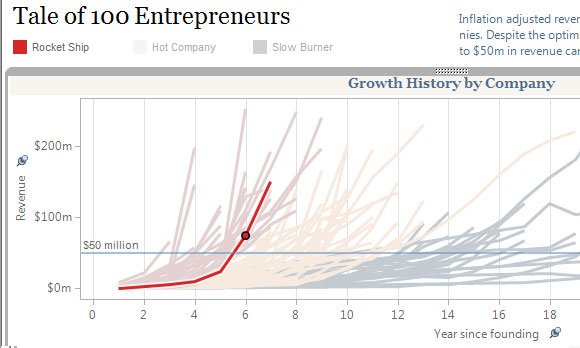
This is an example of charts that you can create using Tableau Software.
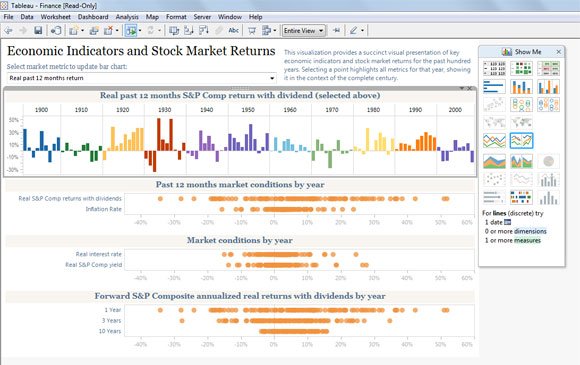
And here we have another colorful chart example with Economic Indicators and Stock Market Returns along the years.