Cloud Skipper PowerPoint Template
Last updated on September 14th, 2024
Often, presentations that have bold designs and flashy colors can strain the eyes of your audience. So when you are presenting information wherein you are going to be heavy with your information, or you simply want something subdued and easy on the eyes, you need to use subtle designs and light colors.
Beauty in Subtlety
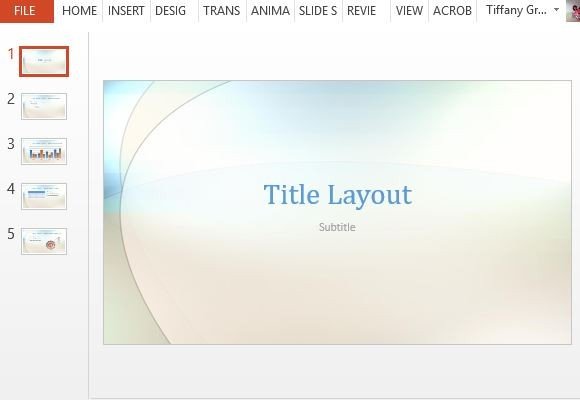
The Cloud Skipper PowerPoint Template is the perfect template that you can use if you’re looking for a pleasant, subtle, yet elegant presentation theme. This template features cloud looking effects on the background, which are so light that they look abstract against the white background. For added interest, there are also curved lines on one side of the slide to serve as a border as well.
This template is versatile enough to be used for many presentation topics, whether for business, school, organization, or personal use. It is also free, so you can download it and use it as many times as you need to. You can easily add this to your collection of go-to presentation templates so you easily have a light-colored theme whenever you need one.
Let Your Data Stand Out
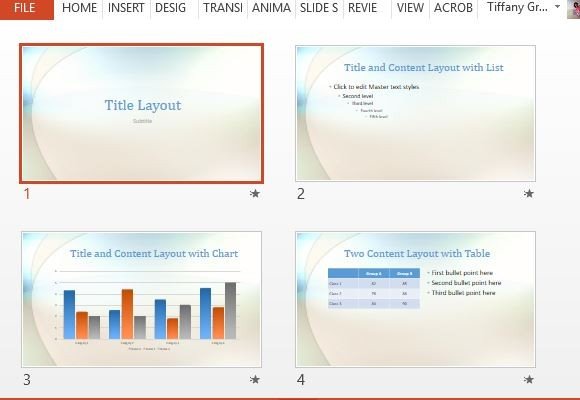
This template easily comes with 5 premade slides that you can instantly use. These slides come as Title Slide, Title and Content Layout with List, Title and Content Layout with Chart, Two Content Layout with Table, and Two Content Layout with SmartArt.
However, if you have other content such as images or captioned pictures, which you want to include, you can sort through the other pre-designed slides in the New Slide menu in the Ribbon’s Home menu. Here, many more slide layouts will populate and you can conveniently choose one that you need. If you still can’t find what you’re looking for, you can easily create your own layout using a blank slide, which you can also use as a transition slide.
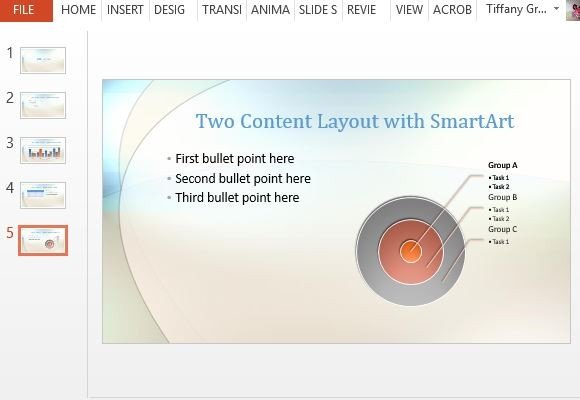
Whatever layout or visual you want to include in your cloud themed slides, you can be sure that your whole presentation will look cohesive. This is because the template comes with charts, graphics, tables, and diagrams that already have coordinating colors that beautifully match the template background. If this is not your preference, however, you can easily change the style and color scheme of the objects. You can also add your company logo, as well as headers and footers, to further customize your slides.
Go to Download Cloud Skipper PowerPoint Template – Alternatively, you can download free slideshow templates for presentations from our website.