Welcome to the presentation blog. Here you can find articles about presentation topics, PowerPoint and productivity tips. The ideal place to learn more about presentations, find the best in town presentation templates and reviews of products related to presentations and public speaking topics. Learn techniques on how to prepare slide presentation layouts and templates designs.
Making an impact during a presentation is not easy in these days, but it is still more important than ever to engage your audience. The default PowerPoint template filled with bullet points and dense text no longer cuts it. That’s where the philosophy of Presentation Zen, originally developed by Garr Reynolds, comes in. Garr Reynolds …
The classic model in the world of presentations is clear: a speaker prepares a deck of slides, presents them in a fixed order, and the audience listens. For decades, this format worked reasonably well for lectures, business meetings, and conference talks. But audience expectations have changed. Today, people seek active participation, personalized content, and a …
In a world where attention is a scarce resource, delivering an effective presentation is more than just reading from slides. Whether you’re pitching a new idea, delivering a keynote, or leading a team meeting, your ability to communicate clearly and confidently can determine your success. That’s where the 4Ps of Presentations come in: Plan, Prepare, …
Spin the wheel tools, also known as random spinners or fortune wheels, are popular for making random selections in a fun and engaging way. Whether you’re hosting a raffle, looking for ways to create engaging PowerPoint presentations, or conducting classroom activities, these tools provide an interactive way to engage an audience. In what is to …
PowerPoint Designer is a feature introduced in PowerPoint 2016, designed to help users enhance their presentations effortlessly. It uses artificial intelligence to analyze slide content and provide layout suggestions that improve the visual appeal and clarity of the slides. Now it is incorporated into the Copilot experience and rebranded as “Design Suggestions”
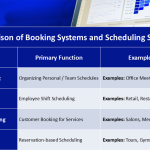
Businesses and professionals need efficient tools for staff management. This includes managing appointments, staff schedules, and customer bookings. Booking systems and scheduling software streamline these processes, eliminating manual effort and reducing scheduling conflicts. However, different software solutions come with features suitable for certain functions. Understanding the distinctions between them is crucial for selecting the right …
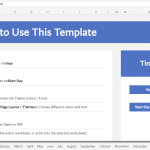
You can use the Calendar template as a free Excel Calendar Creator. It will alllow you to create a calendar for any desired year, automatically and online, using Excel. First, go to Any Year Custom Calendar Excel Template. Then, go to Customize in Excel. You´d need to sign in to your Microsoft Account or using …
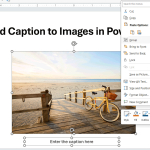
Adding captions to images in PowerPoint helps make your presentations more accessible and visual appealing. Whether you’re a student, educator, or business professional, using captions effectively can elevate the clarity of your message and overall presentation. In this quick guide, you’ll learn step-by-step how to add caption to images in PowerPoint, the difference between captions …
When searching for a job, your resume acts as the first impression you make before a potential employer. A well-crafted resume can mean the difference between getting shortlisted or losing out on a potential opportunity. However, making your resume stand out can be hard in the wake of Applicant Tracking System (ATS), AI generated resumes …
Inserting Harvey Balls in PowerPoint is easy if we have the right images and icons to insert or embed in the slide design. However the are some alternatives if we don’t have the right Harvey Balls graphics. See the recommended Harvey Balls PowerPoint templates we added recently. 1. Free Harvey Balls PowerPoint Template This is …