PowerPoint Charts

Make a Chart in PowerPoint and Excel

We’ve explored creating several kinds of charts in PowerPoint in previous tutorials. We’ve also created a chart and edited it accordingly. Now we will create a chart in Excel and later explain the advantages of using Excel and PowerPoint, their strengths and weaknesses in areas. Creating a chart in Excel is a very straightforward task. You don’t …

How to Prepare Data for Bar Graphs in PowerPoint 2010

In this quick PowerPoint tutorial you will learn how to make data for bar graphs in PowerPoint using Excel. In PowerPoint 2010, the process is much easier than years prior since Excel opens automatically whenever a chart of any kind is inserted into the presentation! Before starting be sure to have your data ready or …

How to Make a Quad Chart in PowerPoint

Quad charts are a highly effective tool for presenting complex information in a visually appealing and easily digestible format. These charts divide data into four distinct quadrants, allowing you to convey multiple ideas or datasets in a single slide. Used across various industries, from business and marketing to research and education, quad charts can help …

Learn How to Use PowerPoint Chart Layouts

PowerPoint Chart Layouts

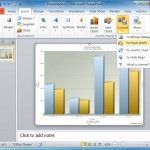
We’re going to explore the different chart layouts in Microsoft PowerPoint 2010. Now we’ll need our chart or page opened to work on. Here we already have a chart made for this tutorial, so you might want to get your own chart or one to practice with ready. Notice in the image above that there is nothing …