Learn how to design robust and creative Mathematical Diagrams using PowerPoint and shapes. Create awesome diagrams with math functions in PowerPoint including popular statistical graphs and curves like the Gaussian curve in PowerPoint.
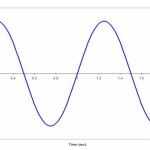
If you need to draw a sinusoidal curve in PowerPoint for your presentations then here we will show different approaches that you can use depending on your needs. A Sine Wave or Sinusoidal wave is a mathematical curve that describes a smooth repetitive oscillation. It is named after the function sine, which is the graph. According to Wikipedia, …
If you need to prepare a PowerPoint presentation for your Math class and need 3D geometric shapes for your slides, then here you can download a free 3D Shapes PowerPoint template with different geometric shape ready to be used in your PowerPoint presentations. PowerPoint comes with preset of 2D shapes that you can use and …
Popular among students, OneNote makes it easy to take down notes and make classroom discussions and dictations so much more fun. And yet, Microsoft ups the ante even further as it releases a new feature, Ink Math Assistant. The new Ink Math Assistant in OneNote is designed especially for students as it helps convert handwritten math …
Advertisement
Advertisement
The Latest FPPT Templates Delivered To Your Inbox
We will send you our curated collections to your email weekly. No spam, promise!