Graph

Turn Your Data into Explorable Networks in Excel
Create-a-New-Table-Or-Select-One-For-Gigraph

Working with Excel spreadsheets and analyzing data as well as catching trends can be tedious and time-consuming. However, it must be done. Analyzing data is important, especially at this time when we deal with large amounts of information on a daily basis. To help you make better sense out of your data, you can use …

Make a Chart in PowerPoint and Excel

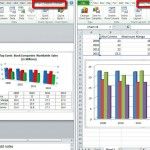
We’ve explored creating several kinds of charts in PowerPoint in previous tutorials. We’ve also created a chart and edited it accordingly. Now we will create a chart in Excel and later explain the advantages of using Excel and PowerPoint, their strengths and weaknesses in areas. Creating a chart in Excel is a very straightforward task. You don’t …

Using Trend Line in PowerPoint 2010 Charts

In this quick tutorial, we will be using trendlines in PowerPoint 2010. In a prior tutorial covering Analysis Tools we went into the purpose of using trendlines and touched on the equation PowerPoint uses in creating the trendline based off of the provided Excel data. A trendline is simply what its name implies, a line …