Advertisement
Awesome 3D Dice Rolled Shapes For PowerPoint Presentations
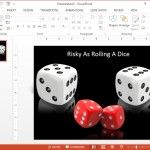
If you want your recreation presentations to look professional yet eye-catching, you should use presentation templates and elements that make your presentations stand out. You can use cliparts to personalize your already existing presentations or further customize your presentation templates. Paired with interesting, textured backgrounds, these clipart images bring much more awesomeness to your presentations.