Project Presentation Tip: Include Project Visuals on your Scorecard
Clients and executives want to easy-to-read scorecards from project managers. They want to quickly see a project status report and key metrics, and they do not want to get overwhelmed with too much detail. Presenting lists of data or complicated project schedules make it difficult for them to understand and digest your information.
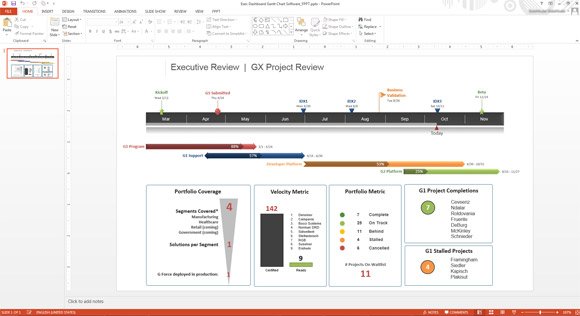
When you are presenting a high-level project review it is critical to include visuals on your slides. Adding project visuals to your presentations gives your audience a fast way to understand the status of your project.
One way to do that is to anchor your scorecard around a graphical, easy to understand Gantt chart. Placing a Gantt chart on your project slide immediately communicates project status to clients and executives in a way that is easy to understand.
How to Add Visuals to your Project Scorecard
Below are two ways that can help you to add visuals to your project scorecard using PowerPoint.
1. Use a Gantt chart template and place it prominently on your scorecard.
The template you use to show a Gantt Chart in a PowerPoint presentation should provide a timeline, key milestones, the critical tasks, and a percent completion graphic to show progress. Anchoring your scorecard with a visual Gantt chart or timeline quickly and clearly communicates project status to executives and clients.
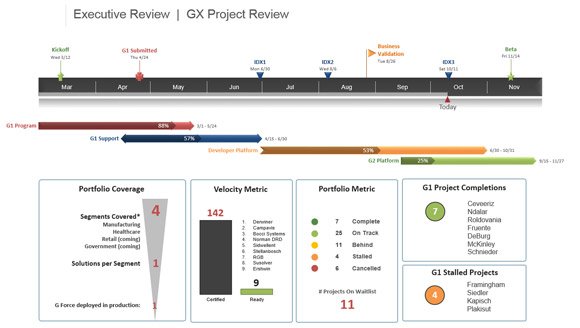
2. If you plan to re-use or update your scorecard slide then you should build it with a PowerPoint Gantt chart maker, as shown below.
The benefit of using Gantt chart software is that it automatically will update the progress on your Gantt chart as the project moves forward, right from with inside PowerPoint.
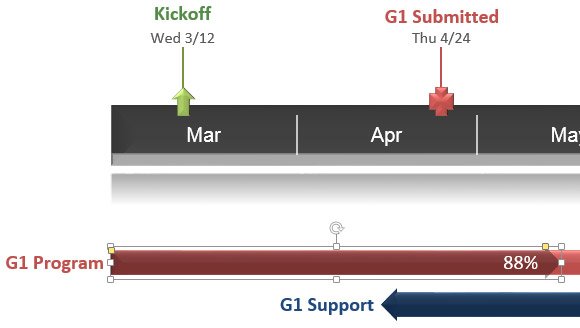
PowerPoint Gantt chart tools also make it easy to update the original chart by adding or removing milestones or tasks as your project progresses, or changing dates and colors or shapes of objects to create more impact.
Moreover, you can easily adjust the diagram design to fit your needs by changing the shape properties. For example, the Gantt completion progress can be updated by resizing the arrow shape without losing any picture quality. The following picture shows an example where we were updating the progress value of the G1 Program activity by resizing the shape in an Executive Review Gantt chart.
Find Gantt chart software that plugs in PowerPoint (PowerPoint add-in), so you never actually leave the familiar PowerPoint application to create your scorecard.