How to Create a Funnel in PowerPoint
Last updated on December 31st, 2024
Microsoft PowerPoint is a valuable tool to create presentations (the most popular worldwide); to make them more appealing, you can add images, plots, videos, and diagrams. Funnels are widely used in presentations to demonstrate various processes, such as sales, marketing, lead generation and conversion stages.
Creating a funnel in PowerPoint can help you visualize these processes more effectively, making your sales or marketing presentation more engaging and informative. In this article, we will walk you through a step-by-step guide on how to make a funnel in PowerPoint.
How to Make a Funnel Diagram in PowerPoint?
Make a Funnel Slide Design using Shapes in PowerPoint
Here are the steps to make a funnel slide and diagram in PowerPoint, using shapes.
Step 1: Open PowerPoint and Create a New Slide
- Launch PowerPoint and open a new presentation or an existing one where you want to add the funnel.
- Click on the “Home” tab, and then select “New Slide” to add a new slide for your funnel.
Step 2: Choose a Funnel Shape
- Click on the “Insert” tab.
- In the “Illustrations” group, click on “Shapes.”
- In the dropdown menu, choose the “Trapezoid” shape (located under the “Basic Shapes” category).
Step 3: Draw the Funnel in PowerPoint
- Click on the slide to create the trapezoid. You can resize and position it by dragging the shape’s edges and corners.
- To make the trapezoid look more like a funnel, right-click on the shape, and select “Edit Points.”
- Click on the bottom-left point and drag it inwards, and then do the same for the bottom-right point.
- Adjust the points until you achieve the desired funnel shape.
- To change the color of the funnel, right-click on the shape, select “Format Shape,” and choose a color under the “Fill” tab.
Step 4: Add Text to the Funnel
- Click on the “Insert” tab and choose “Text Box” from the “Text” group.
- Click and drag to create a text box within the funnel shape.
- Type your text (e.g., “Awareness” for the top of the funnel) and customize the font, size, and color as desired.
- Repeat the process to add additional text to different segments of the funnel.
Step 5: Create Additional Segments
- Repeat Steps 2 and 3 to create additional funnel segments, resizing and positioning them to fit within the original funnel shape.
- Customize each segment’s color and add text as needed.
Step 6: Group and Align the Funnel Segments
- Click and drag to select all the funnel segments.
- Right-click and choose “Group” > “Group” to group the shapes together.
- With the grouped funnel selected, click on the “Format” tab and choose “Align” > “Align Center” to align the funnel segments horizontally.
- You can also adjust the vertical spacing between the segments by selecting “Align” > “Distribute Vertically.”
Step 7: Add Additional Elements (Optional)
- Consider adding additional elements to your funnel, such as arrows or icons, to illustrate the flow or highlight specific points.
- Use the “Shapes” or “Icons” options within the “Insert” tab to add these elements to your slide.
Create a Funnel Diagram in PowerPoint using SmartArt
The Funnel Diagrams in PowerPoint allow you to make an explanation of proportions more intuitive. Funnels can be used for a variety of purposes, but some of the most common funnel styles are known as purchase funnel, sales funnel, marketing funnel or decision funnel.
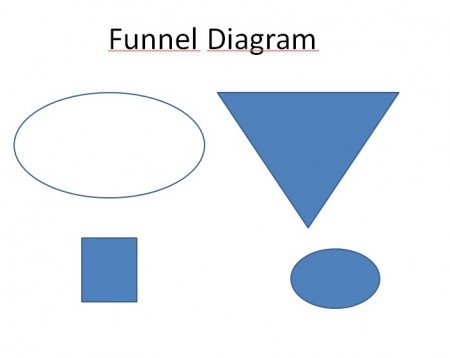
First, we need to draw some shapes. We are going to need a big Triangle, a rectangle and two circles. Just like this:
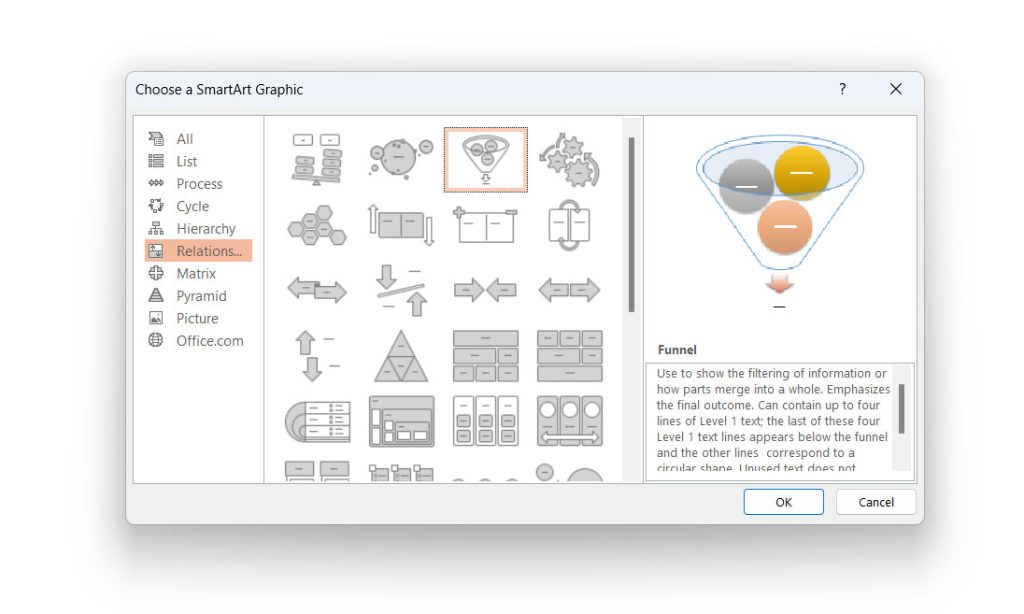
But you can also use SmartArt to generate a funnel diagram design in PowerPoint. To make a funnel chart in PowerPoint using SmartArt, go to Insert -> SmartArt and look for the Funnel diagram under Relationships diagrams.
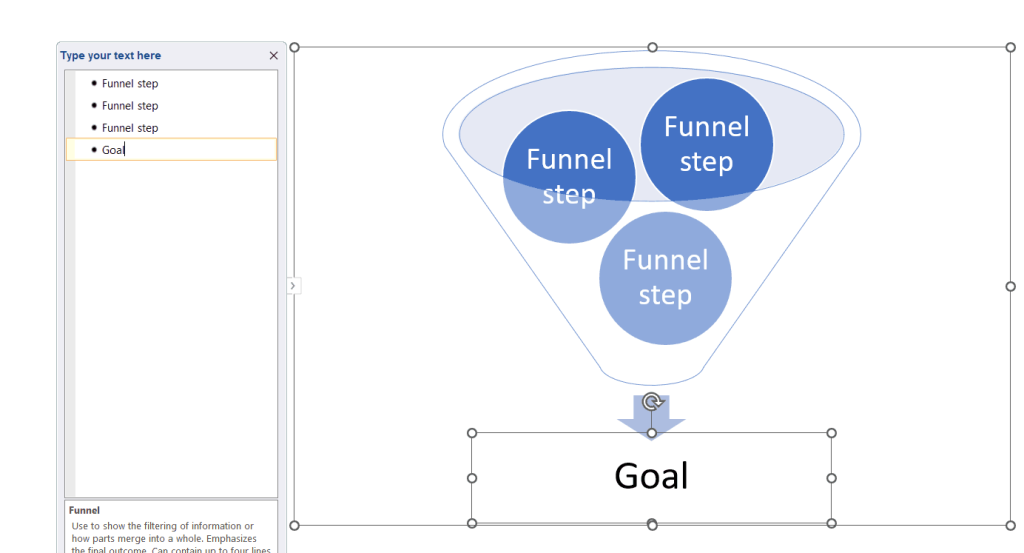
Then, start adding the funnel steps or stages in the section below. You may need to resize the shapes and change the outer line to make it fit. Also you can add shadows or change the color according to your presentation.
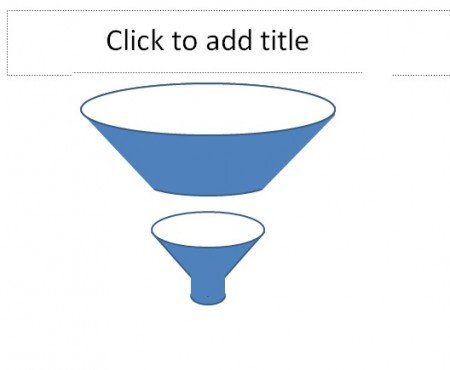
If you need a more complex funnel diagram you just need to create more shapes and keep them in order so it looks nice (You may need to use triangles with no line and no fill to make it fit):
In the next weeks we will show you how to create nice 3D Funnel diagrams in PowerPoint with variants of this technique.
The same technique can be used if you need to make a sales or marketing funnel diagram in Google Slides.
Download Premium Funnel Toolkit PowerPoint Template
If you need to create professional looking Funnel diagrams in PowerPoint you can download the Funnel Toolkit template for presentations. It contains different slides in PowerPoint with funnel diagrams that you can customize for your presentations.
Download Funnel Tookit from Presenter Media
You can also access thousands of premium PowerPoint templates and 3D graphics for your presentations including thousands of PowerPoint diagrams created with shapes.
Conclusion
Creating a funnel chart in PowerPoint is a simple and effective way to visualize processes in your presentation. They can be useful for representing the different stages in sales processes, marketing, lead generation and convertion rate optimization. By following these steps, you can easily create a customized funnel to enhance your slides and deliver a clear, engaging message to your audience. Happy presenting!