How to Create a Custom Chart Template in PowerPoint
Last updated on December 27th, 2024
You can create a custom chart in PowerPoint if none of the existing preset charts fulfill your needs. It could be a good idea to make a custom chart in PowerPoint with your own styles and effects if you want to modernize the charts used for your presentations and why not create new visualizations for your slides. Also, creating custom chart templates can be a good way to save time in the future when you need to use the same chart design and styling.
To create a custom chart in PowerPoint you will need to insert a chart from the Chart gallery. You can do this from Insert tab and then Illustrations section and click on Chart. Here, choose the chart type that best fit your needs.

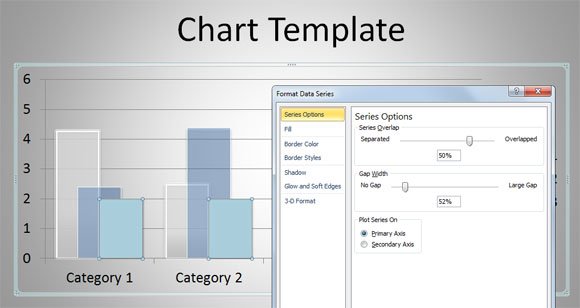
Now you can apply the styles and change the chart template. Depending on the chart type that you choose as base you will be able to change different properties. For example, below you can see the series options for a basic bars chart in PowerPoint.
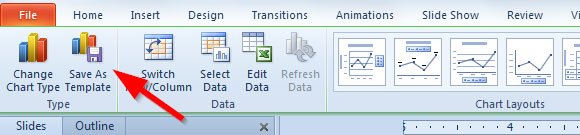
When you are done with the changes, you can now save the chart as a template. Select the chart and under the Design menu you will find Save As Template button. Here you can specify a target .crst file for the chart template.
Related articles:
Next time you want to use the chart template, you just need to insert a new chart in PowerPoint and look for the Templates folder. You can download free .crst charts for Microsoft PowerPoint.