How to Add an Excel Chart to a PowerPoint Presentation
Last updated on March 18th, 2024
There may be times when you want to copy charts from Excel into your PowerPoint presentations. For example, if you are preparing a dashboard in PowerPoint or the annual organization report before the strategy planning. In this case, we will be interested in copying charts from Excel spreadsheets into PowerPoint.
Let’s say we have the following data in Excel, along with a simple line chart for the sales report in aPowerPoint presentation.
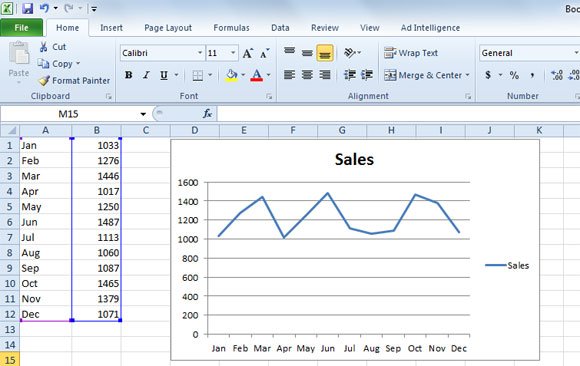
We will see below different ways to insert the chart in a PowerPoint presentation.
Insert Charts as Picture
The easiest way to insert charts is using copy-and-paste. You can insert charts as pictures, which means that once you copy the chart and paste it in PowerPoint, it will be embedded in the presentation as an independent picture. So, if you change the original chart, you will need to repeat the process. Because of its simplicity, this is the common way to insert charts and other graphics in PowerPoint, but it is not always the desired way.
Insert the Excel Chart in PowerPoint and Update it Every Time the Source Data is Changed
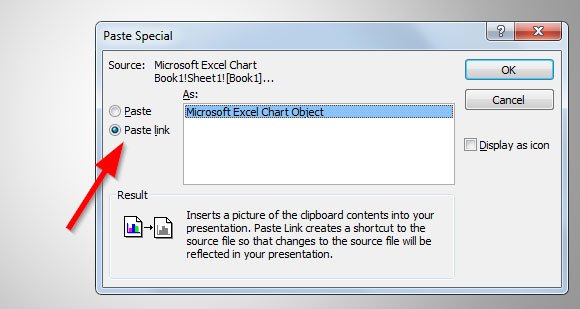
Another interesting way to insert a chart in PowerPoint presentation is using the following approach. Every time you change the original Excel data the chart will be automatically updated either in Excel and PowerPoint. For this purpose, you will need to use Paste Special and insert the chart using the Paste link option.
You can use Paste Link to insert a picture of the clipboard contents into your presentation. Paste Link creates a shortcut to the source file so that changes to the source file will be reflected in your presentation automatically.
This approach is great for example if you are preparing a PowerPoint presentation but you don’t have the final data source yet or the final charts for your presentations. You can prepare the chart using a template and then do proper changes in your sources to reflect the changes in the PowerPoint presentation. Of course, you can also reuse your .ppt file every time in the future to apply the new changes, especially if you are preparing a report that can be reused many times.
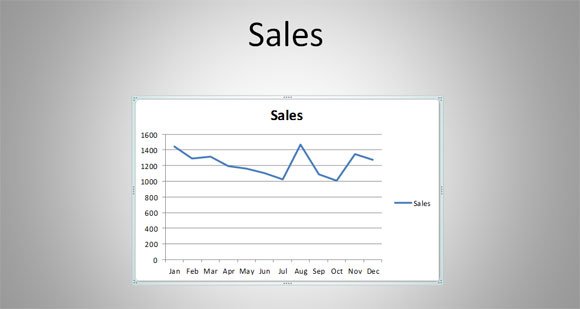
This will create a linked version of the picture to the original chart in Excel source spreadsheet.
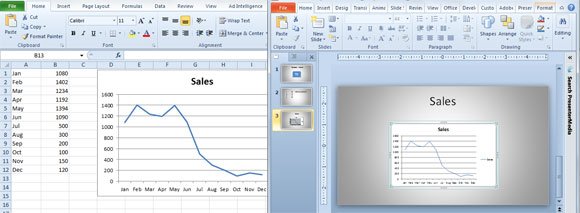
Now, if you update the original source you can see that the changes are automatically updated in the PowerPoint presentation which was the desired effect.
This can be great for managers, company employees but also for PowerPoint designers who need to prepare templates and presentations for their clients. For example, you can use this approach to prepare a monthly ales report template for PowerPoint with charts that will be updated periodically from the Excel source. Alternatively, you can learn how to copy a table from Excel to PowerPoint or use AI to create a PPT from Excel.