How To Automatically Create Process Diagrams in Visio Using Excel Data
It’s no rocket science and in fact it’s really nothing new—we understand and remember information better when we can visualize it. In school, class discussions are more dynamic and effective with the help of visual aids instead of hours of lectures and recitations. In the corporate setting, visualizations are the lifeblood of organizations and businesses. From high-level decision-making to reaching out to the general public, companies invest in visualizations that drive their message home. You can now create elaborate visuals and data-driven diagrams in Visio using Excel with the help of the Data Visualizer feature.
Whether you’re juggling huge amounts of enterprise business intelligence or simply want to ace your school presentation, Visio can definitely help you with that.
Create Process Diagrams through Visio’s Data Visualizer Feature
Every day, a company’s operations is run by dozens of interrelated processes. Like cogs in a complex machinery, these processes are vital in ensuring that operations flow smoothly, standards are maintained, schedules are met, and every step of the way follows compliance policies.
This is why from new-hires to executives, it’s important that everyone is familiar with the processes that occur in their company. However, processes can often change, especially if your organization is geared towards keeping up with various demands on a case to case basis. While processes must be flexible, this can be difficult to translate into a visual format. It can take up a lot of time and resources that are better off spent on core competencies that will have direct results. Still, this must be done.
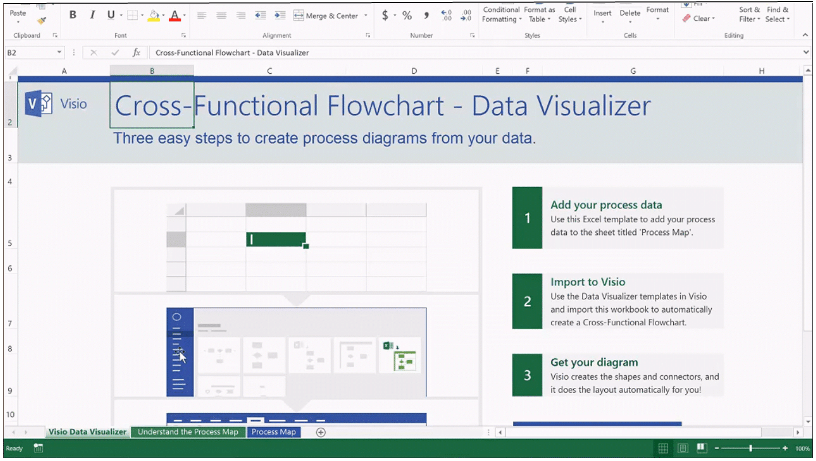
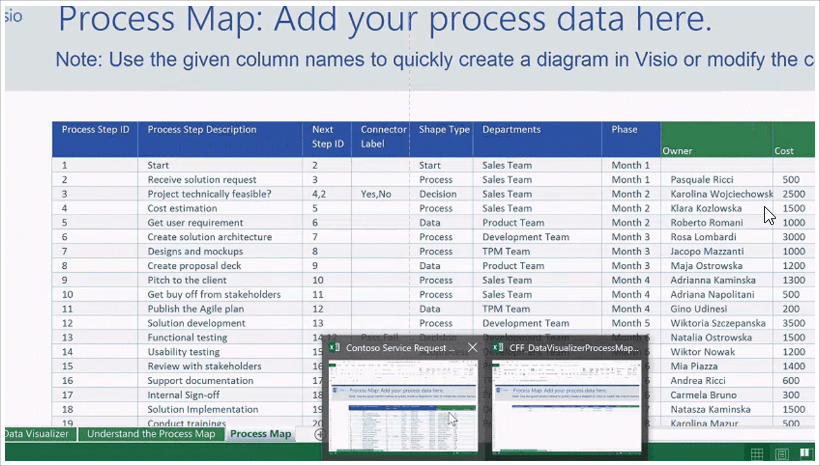
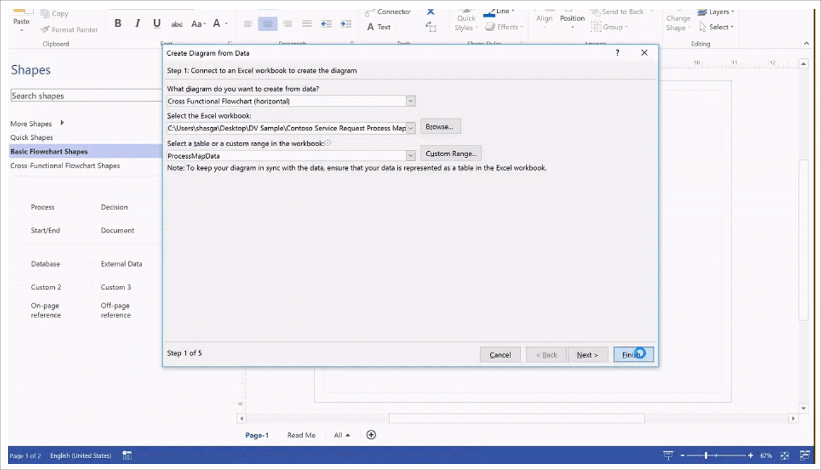
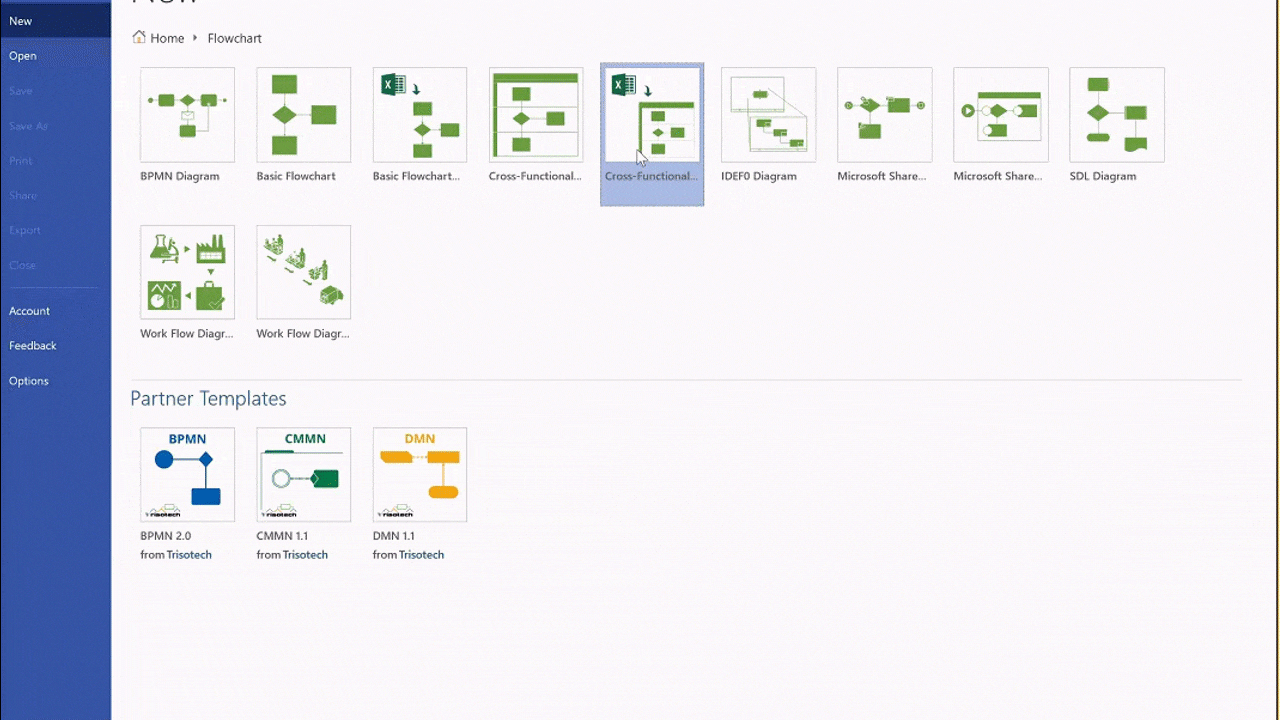
And this is why Visio takes the cake when it comes to creating dynamic process diagrams. Visio allows you to set up your data easily using a software that you already have and are probably well-versed at—Excel. In the form of a spreadsheet, you can set up your data in rows and columns. Then, in Visio, you can go to the File menu, choose New, then Business, and click on the wizard to create your process diagram.
The wizard will show you a series of easy to follow instructions to create your process diagram from your Excel data. Just confirm the correct fields and click Finish to generate your finished process diagram.
You can further customize this to reflect your brand or theme with Visio’s Theme Colors and Theme Effects. You can format the diagram as a whole or click on each component in the diagram to apply unique formats and settings.
Quickly Convert Excel Data into Stunning Visuals with Visio
For organizations, Visio can present lots of possibilities for presentations, reports, analysis, and decision-making. Analysts can take an Excel table and quickly convert it into a diagram, thanks to Visio.
With the help of a premade template or your own company’s data and spreadsheets, you can create visuals in Visio with just a few clicks of the mouse or a few taps on your smartphone or tablet. You can create Visio even on the go.
Visio’s Data Visualizer feature provides you with an easy-to-follow, step-by-step interface where you are guided in transforming your Excel data into Visio process diagrams. Visio has a wide range of designs and templates that you can also customize. The predefined visuals, like flowcharts and diagrams, are all linked to your Excel data so that if the data is modified, it is accordingly and automatically reflected or updated on Visio.
This means convenience and accuracy for the organization, two things that does not always come hand in hand in data visualization. You save less time creating diagrams and flowcharts from scratch as you base it on your Excel data. You also don’t have to create another whole range of visuals for every change or update you have on your data. Still, you can be sure that your visuals accurately reflect your figures, which is vital in sound decision-making and impressive in reporting and presentations.
Easily Collaborate with Visio for Office 365
What’s great about Visio is it’s compatible with your Office programs. This takes out the hassle of having to switch from different applications, download and learn new ones, or convert your files to match the other applications. With Visio for Microsoft Office, you can seamlessly integrate your data to create outstanding visuals and export them to your reports or presentations.
With Office 365 adding Visio onboard, you can easily work with your team remotely or on-the-go. You can seamlessly share your data and convert them into visuals with Visio without skipping a beat. You and your team can conveniently work on the same diagram, chart, or table, making it easy to keep everyone posted on your progress and changes.
Visio also has a standard version that has rich and robust features that can help you make the most out of your visuals so they come out looking great and professional.