Analyze Engagements using Sway Analytics for your Sway Presentations
With Microsoft’s Sway, creating content and sharing information has become easier than ever. Collaboration and working seamlessly across different devices has also become less of a hassle. However, how would you know that your Sways are reaching the target audience and are effectively delivering your message? How do you know that your content is accessed all the way to the end? Don’t sweat it–Sway Analytics does the job to get rid of the guesswork and any uncertainty for you. It also gives you valuable insight to help you as you create your next Sway or think up a new topic. With Analytics, you definitely Sway smarter.
Get Priceless Insight with Sway’s Analytics
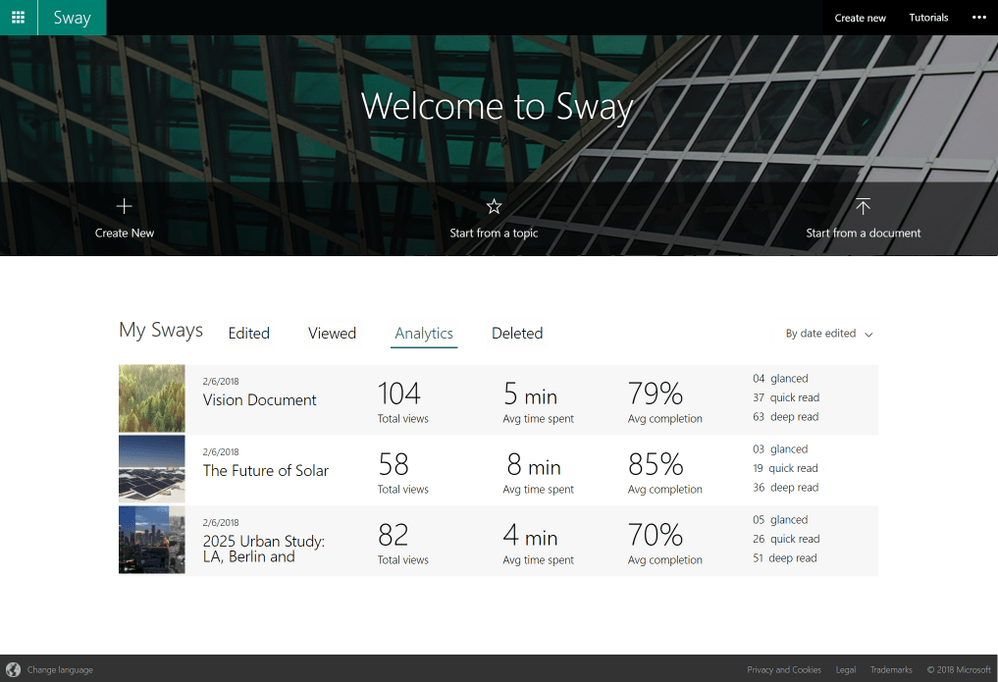
With Sway Analytics, users can see valuable insights that they couldn’t otherwise have using other presentation or content creation program. For one, you can see a breakdown of the readers or audience who glanced at your Sway give it a quick skim or gave it a deep read. You can also see the average time spent on your Sway and the average completion time of going over it from start to finish.
Having a better handle on all this information can help you realize if the content you’re creating is presented in a way that effectively cuts through the noise enough to attract your audience. It will also let you know if your audience is interested enough to read more and really digest your information. If they are just glancing on your Sways, then you will know if you have a real problem in your topic or content creation.
With all this information, you can better understand your audience. How they interact with your content, what kind of content they like, how long they go over your content, and many other insights.
Get Better Insights with Sways Used as Newsletters
Sway is also widely used as a newsletter within an organization or as a way for companies to interact with their customers. Using Sway like this, users can get valuable insight into how much of the information they send out is getting read and thoroughly, at that. Or if it’s getting ignored or is coming off not as effectively as it should be, Analytics can show data on this as well.
Under My Sways, you can see the Analytics tabs and here, you can see every content or Sway you’ve worked on. Here, you’ll see the total views, average time spent, average completion, and the number of people who have glanced, did a quick read or did a deep read.
Have More Control Over Your Sways
Sway also has an admin function, which allows you to have more control over your Sways.
As an admin, you have control over how Sways are created and viewed by your people and your audience. You can create restrictions and security measures, as well as block any counted sources that are included in Sways that are getting made. You can also restrict sharing among people in your organization.
With all these features, especially with Sway Analytics, you can empower yourself to create better and more engaging content to increase engagement and impart information more effectively. You can also use the valuable insights from Analytics to get to know your audience better and therefore tailor more impactful Sways that effectively get your message across and spur them to action.