
Advertisement
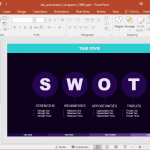
11+ Aesthetic Backgrounds for Presentations
When was the last time you paid attention to a presentation with a blank background? While complex PowerPoint backgrounds can be distracting, using aesthetically pleasing backgrounds with a balanced color tone can help make your presentation more attention-grabbing. For the best aesthetic backgrounds to use in presentations, including free PowerPoint templates, see our collection of …