Swimlane Diagrams Explained: Visualizing Workflows in Presentations
Last updated on October 23rd, 2025
When explaining how tasks move across teams or departments, slides filled with bullet points often fail to capture the complexity of real processes. That’s where Swimlane diagrams come in as a visual technique that helps presenters organize workflows, define responsibilities, and communicate how different roles interact within a process.
What Is a Swimlane Diagram?
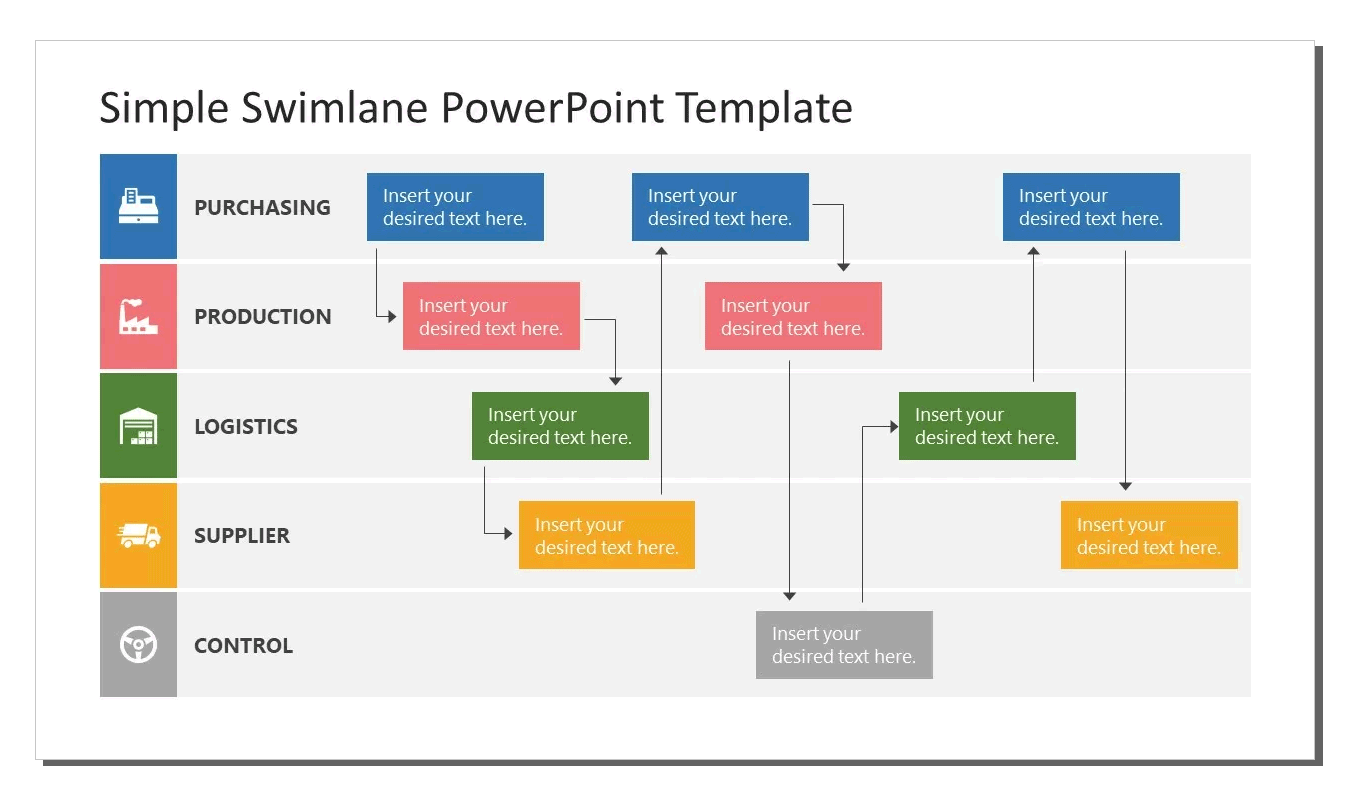
A Swimlane Diagram, also known as a Cross-Functional flowchart, is a visual map that divides a process into parallel lanes.
Each lane represents an actor, department, or system, and the activities within those lanes show what each one is responsible for. Then, arrows between steps indicate the order of operations or interactions.
Think of it like a pool with lanes: each lane has a swimmer (a role or department) following a defined path. In fact, many swimlane diagram & infographics mimic the pool with lanes. The diagram helps identify who does what and how information flows from one area to another.
Common uses of Swimlane diagrams include:
- Visualizing business processes, like order fulfillment or customer support.
- Clarifying project workflows, such as product development or onboarding.
- Explaining academic or administrative procedures, like research approvals or grading systems.
Why Use Swimlane Diagrams in Presentations
When presenting to stakeholders, teams, or students, swimlane diagrams help you:
- Clarify complexity: break large processes into digestible pieces.
- Assign accountability: show who is responsible for each action.
- Encourage understanding: your audience can follow the flow at a glance.
- Support decision-making: makes inefficiencies or overlaps visible.
In short, a well-designed swimlane diagram in a presentation transforms confusing process descriptions into visual stories your audience can grasp in seconds.
How to Make a Swimlane Diagram in PowerPoint
Creating a swimlane diagram in PowerPoint is straightforward and doesn’t require additional software if you know how to manipulate shapes and graphics in Microsoft PowerPoint. Here’s a quick walkthrough:
- Start with a Blank Slide: Choose a 16:9 layout for better horizontal space.
- Add Lanes: Insert rectangles for each department or role. You can also use SmartArt → Process → Horizontal Picture List for a fast layout.
- Label Each Lane: Write the role, team, or function name inside the rectangle.
- Add Flowchart Shapes: Use rectangles for actions, diamonds for decisions, and arrows for process flow.
- Color-Code Lanes: Assign each lane a subtle color to enhance readability.
- Align and Group Shapes: Keep spacing consistent for a professional appearance.
- Optional – Animate the Process: Apply Appear or Fade animations to reveal steps progressively as you present.
To save time, download a free Swimlane Diagram Template for PowerPoint from our website. These ready-made swimlane PPT templates include editable lanes, connectors, and labels that you can easily adapt to your own workflow.
If you need a professional design, then you can download swimlane PPT templates from SlideModel.
Presenting a Swimlane Diagram
Once your swimlane diagram is ready, presenting it effectively can make a big difference. Here are a few best practices for the presentation time:
- Tell the Story Step by Step: Don’t show the entire process at once. Use animations or slide transitions to move through each phase logically.
- Highlight Interactions: Emphasize where one role hands off work to another. These moments often define the efficiency of a process.
- Zoom In Strategically: PowerPoint’s Zoom or Morph features allow you to focus on individual lanes for deeper explanation.
- Keep It Simple: Limit the number of lanes (ideally 4–6) and avoid cluttering with too many details.
- Color and Contrast: Use consistent visual language — e.g., blue for internal teams, green for external partners.
By narrating the process visually and interactively, you turn a static swimlane diagram into a dynamic presentation.
Using Swimlane Slide Templates to Save Time
Designing a swimlane diagram from scratch can be time-consuming. FPPT offers free presentation templates that streamline the process. However, if you are looking for a professional service, you can subscribe to SlideModel.com and download any of their editable Swimlane PPT templates.
Recommended options include:
- Cross-Functional Process Diagram Template
- Business Workflow PowerPoint Template
- Swimlane Process Flow Template
These swimlane PPT templates are fully editable in both Microsoft PowerPoint and Google Slides, allowing you to customize lanes, arrows, and text boxes while keeping the structure professional.
Final Thoughts
Swimlane diagrams can be used to visualize a process and its interactions. By mapping workflows across departments or roles, presenters can make complex operations understandable and actionable. Whether you’re explaining a business process, teaching an academic procedure, or managing a project timeline, a clear swimlane diagram can make your message stick.