How to Make a 100 Chart Template for PowerPoint
If you need charts for Math then a 100 chart template can be useful to teach your students about the numbers from 1 to 100. Here we will show you how easy is to make a 100 chart template in Excel and then copy and paste it into PowerPoint for your presentations on Maths.
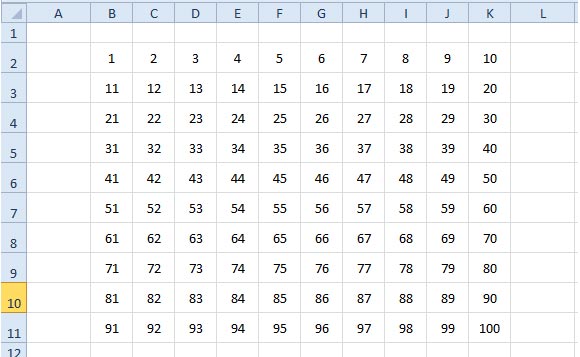
First, start Excel and then start adding the numbers for the first row. You can start adding the 1 to 10 numbers from left to right.
Now, under the 1, enter a formula given by =B2+10, where B2 is the cell where you added the number 1. Copy and paste it horizontally 10 times and then vertically 9 times (because the first line was entered manually).
Now you will have a 100 table chart like the following image.
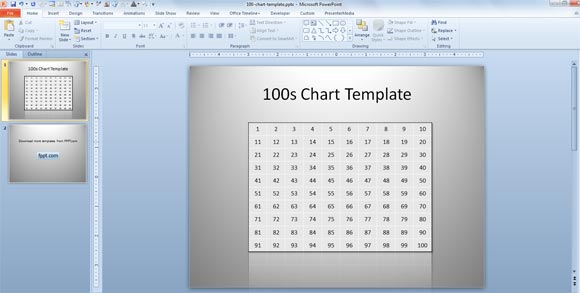
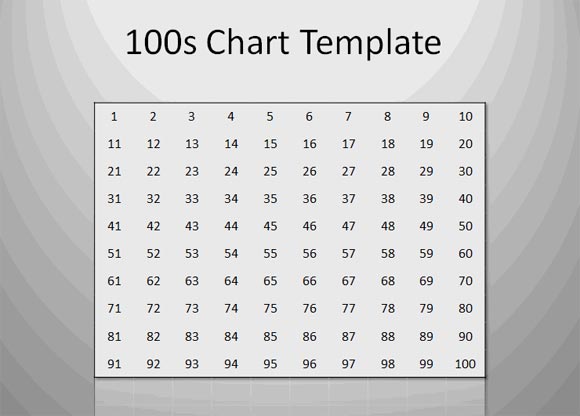
Now, select the table range and then copy and paste it into PowerPoint. You can adjust the table properties in PowerPoint 2010 for example to give a better look and feel. And you can add some nice shadows and table effects.
Moreover, if you need to make a blank 100 chart template to make your students fill the missed elements then you can manually remove the cells where you don’t want the number to appear.
We have learned how to make a 100 Chart Template for PowerPoint 2010 and other versions of PowerPoint. Now you can try to replicate the same steps or download free 100 chart template for PowerPoint from here.
100 Chart Template PowerPoint (1206 downloads )