How to Create a Venn Diagram in PowerPoint
Last updated on June 6th, 2024
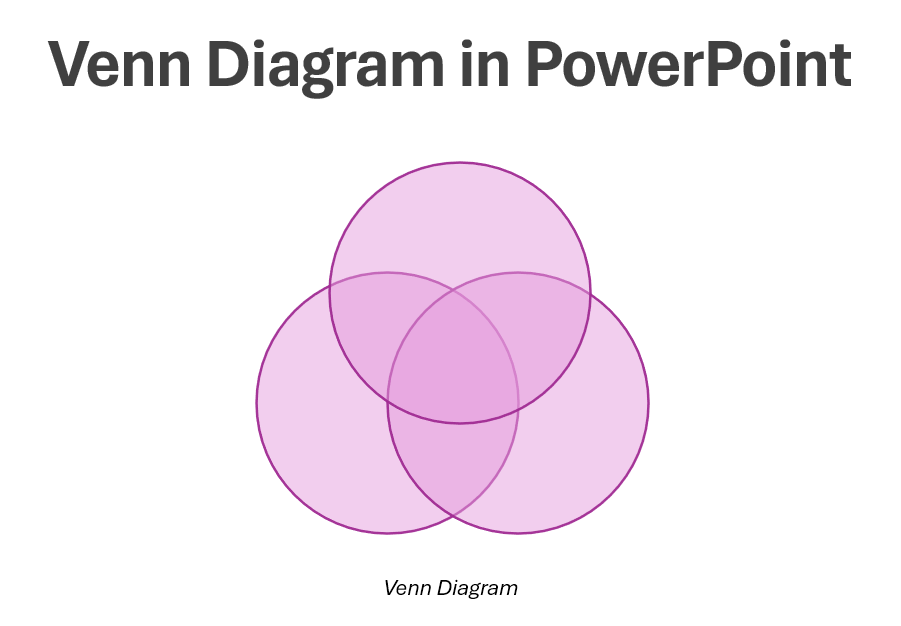
Venn Diagrams are often used to create intuitive graphics in which you want to make correlations between different groups. Microsoft Powerpoint can help you creating Venn Diagrams with the SmartArt tool.
There are different ways to generate Venn diagrams in PowerPoint. In summary:
- You can use Venn Diagram PowerPoint Templates
- You can create a Venn Diagram using SmartArt Graphics
- You can create a Venn Diagram using Shapes in PowerPoint
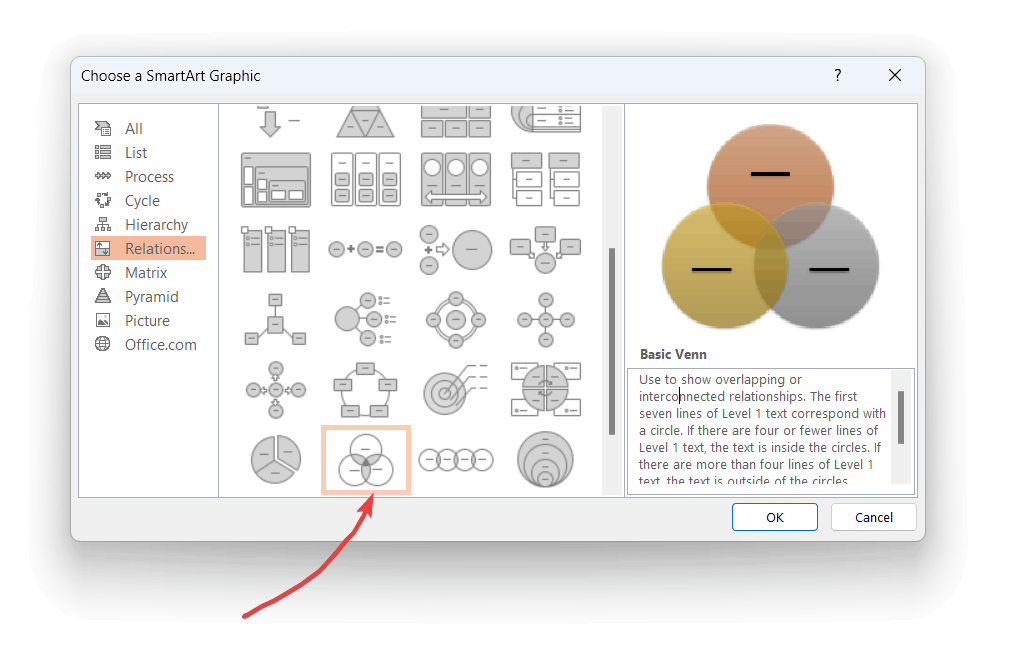
To create a Venn diagram in PowerPoint using SmartArt graphics, go to Insert tab and click SmartAr.t
Here you will find a wide variety of graphics and Venn diagram templates that you can use to produce high-quality Venn diagrams; you will find a category for Basic Venn Diagrams under the name Interconnected Rings.
Use to show overlapping or interconnected ideas or concepts. The first seven lines of Level 1 text correspond with a circle. Unused text does not appear, but remains available if you switch layouts.
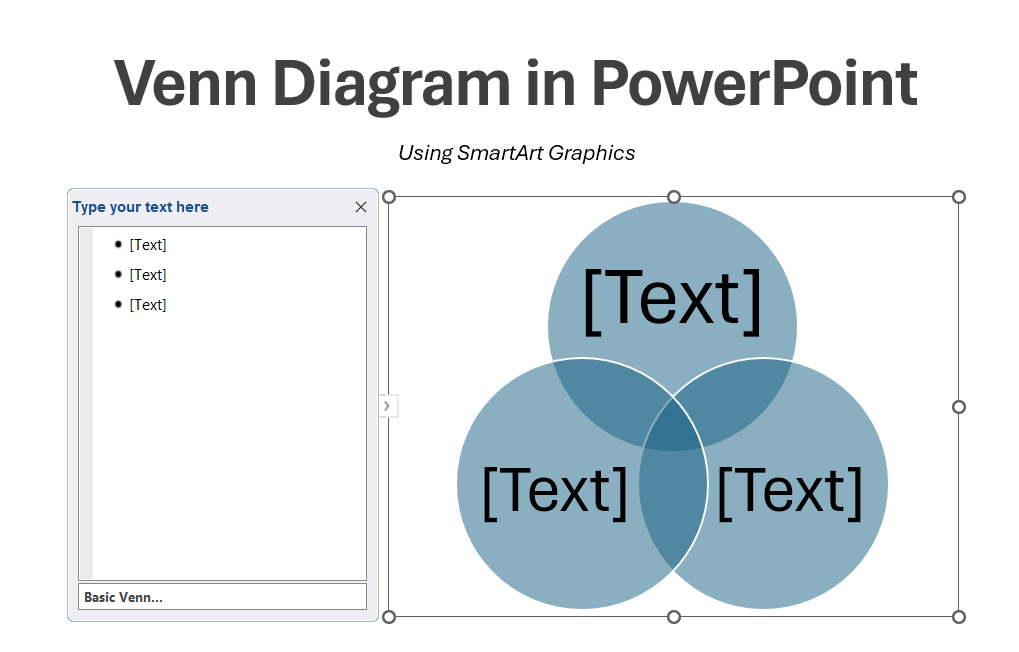
Pick the one you prefer and then you just need to give it the look you prefer.
Related: Venn Diagram Toolkit for PowerPoint
You will need to enlarge the circles to make them intersect each other. To do this, you can go to SmartArt Tools -> Format menu and then look for the Larger button. Make sure to have the three circles selected before pressing this button.
So, then the Venn Diagram will look like in the picture below.
We have learned how to create a basic Venn Diagram in PowerPoint so now you are welcome to try it by yourself, you can try using any of our free PowerPoint templates including these templates for Business presentations.