Free PowerPoint Template for Cluster Analysis
If your job is related to analyze data and cluster analysis and need to prepare a PowerPoint presentation to show the conclusions and outcomes, then using the following free cluster analysis PowerPoint template can help you to impress your audience. This is a free PowerPoint template and diagram that we created for you to be used in Microsoft PowerPoint 2010 and 2013, but you can also use it in Microsoft PowerPoint 2007.
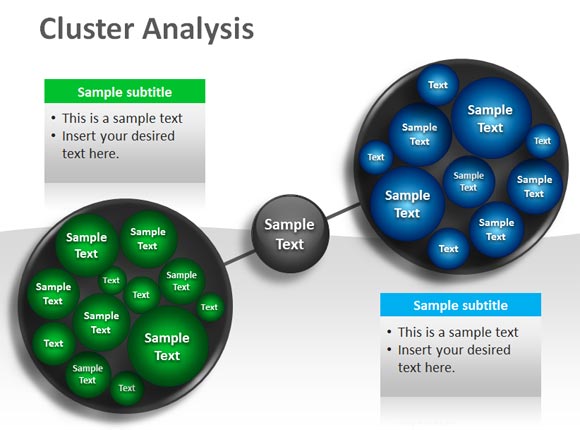
Cluster Analysis template for PowerPoint contains two big circles (representing Big Data) and then small circles inside each big circle. The idea behind this original cluster template for PowerPoint is that you can edit the text inside the small circles to represent data in a cluster analysis PowerPoint presentation.
Clustering is the task of grouping a set of objects in such a way that objects in the same group (which are called clusters). You can group elements and objects that are more similar to each other. This is used in exploratory data mining, and a common technique for statistical data analysis used in many fields, including machine learning, pattern recognition, image analysis, information retrieval, and bioinformatics.
You can also use the color legend and the small tables to describe the content and concepts used in the slides. If you need, you can remove the central circle with Sample Text that we have added.
Cluster Analysis PowerPoint Template (3005 downloads )