FooPlot: Plot Math Functions for PowerPoint Presentations
FooPlot is a simple online plotting tool suitable for any student or Math teacher who need to plot a function and then embed the image in the slides for the classroom, but you can also use the free plot tool for other applications.
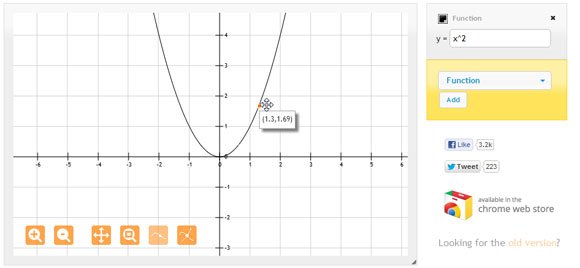
To use FooPlot, open your browser and then open the URL http://fooplot.com – You can see a simple chart in the slide with a default function, but on the right you can change the function y = x² to model another desired function.
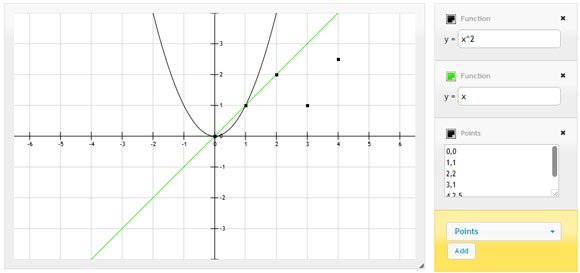
For example, if we want to plot a line in PowerPoint we can create another function and add a line or plot points in the coordinating system.
You can change the color of the lines or points and finally when you are ready to transfer this to your PowerPoint slides or template you can save the output as a PNG image or SVG. PNG will contain a transparent plot while SVG is the vector representation (Scalable Vector Graphics). Alternatively you can also save the output in EPS Encapsulated PostScript or even in PDF.
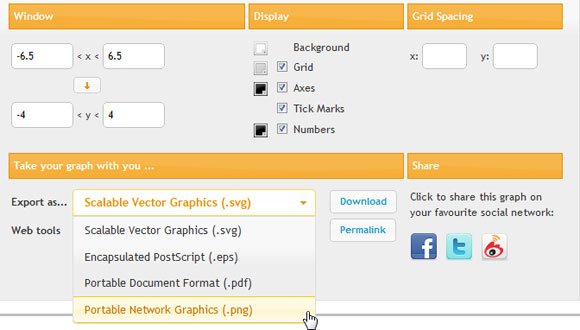
Notice that Office programs do not support the SVG file format so the desired output format would be PNG for the image. Inserting an image in the slide is simple, but if you need to export to vectors, then you can use Corel Draw or Illustrator to save the vector to another output. Using SVG with PowerPoint won’t be recommended because you need to rely on external applications or component, like ActiveX components.