Calculating for Standard Deviation in PowerPoint 2010
One of the beneficial features of Microsoft PowerPoint 2010 is its ability to incorporate functions and applications . For instance, Microsoft Excel is an independent application which due to versatility of PowerPoint 2010, users are allowed to utilize almost all functionality of Microsoft Excel via PowerPoint 2010. This includes computing data as well as graphing these data simultaneously in the PowerPoint Presentations. One example is calculating standard deviation of a sample data.
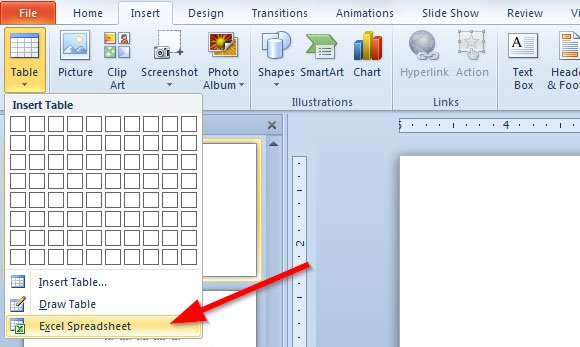
To start off and calculate the standard deviation by using a spreadsheet in PowerPoint, you can open a PowerPoint 2010. Go to Insert tab, select Table option and click on Excel Spreadsheet.
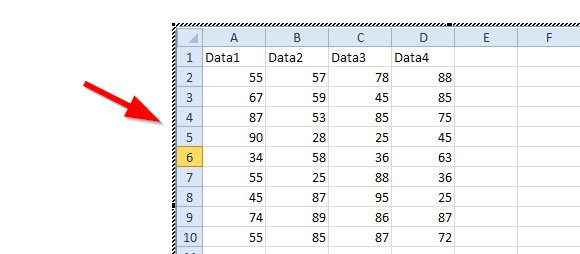
Now you can see a spreadsheet embedded in the PowerPoint slide. Here you can add sample data for your standard deviation calculation.
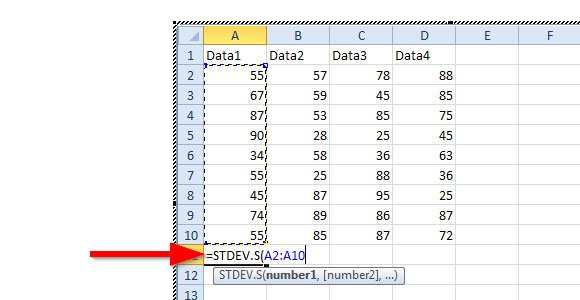
Now you can add formulas like in Microsoft Excel. You can for example use the STDEV.S to calculate the standard deviation of a data range.
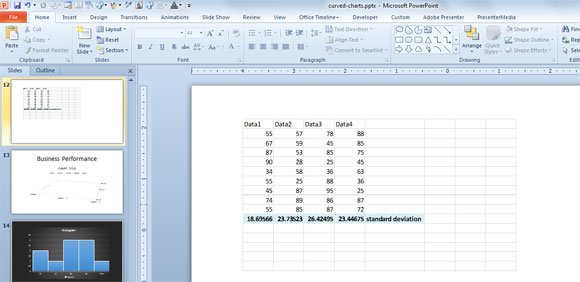
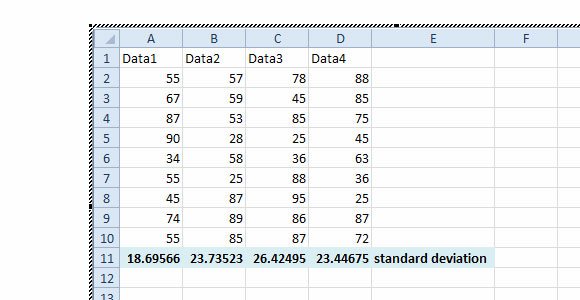
Then, you can copy and paste the resulting formula/data in the other 3 cells and apply a different format to the cell. As you can see below, the standard deviation for each data set is displayed. You can now exit the edit mode to return to PowerPoint.
Now, to calculate for the standard deviation of the population (or all of the sample data), type STDEV.P.