Blood Sugar Tracker Template For Excel
Blood Sugar Chart Template for Excel is meant for logging sugar levels in Excel. The added data automatically generates a blood sugar chart, which shows trends for your blood sugar levels over a period of time.
Generate a Blood Sugar Level Chart Based on Added Data
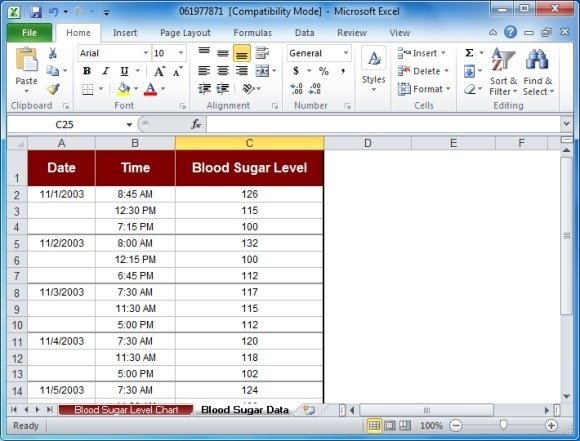
To create your blood sugar level chart, enter recorded levels in the ‘Blood Sugar Data’ worksheet in this template. This will automatically populate the trends on the ‘Blood Sugar Level Chart’ worksheet, to provide you with a visual representation of your blood sugar levels over a period of time.
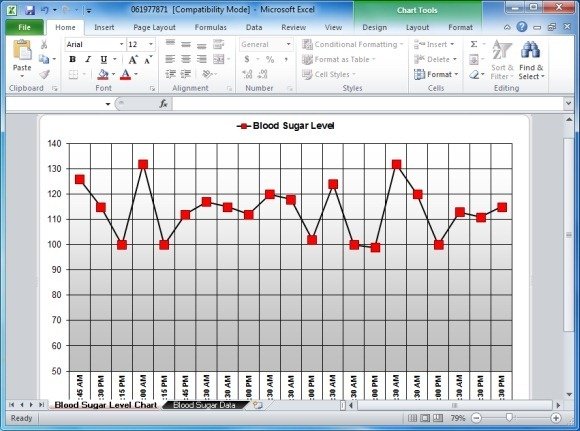
As you can see from the screenshot given below, the Blood Sugar Data worksheet provides different rows to enter information about the date, time and blood sugar levels. This worksheet is connected to the graph in the Blood Sugar Level Chart worksheet (shown above). This can help you keep track of your blood sugar levels or of a loved one, to identify important trends regarding any possible issues which may need the doctor’s attention.
While people with a blood sugar monitor can use this template to track trends, it can also be of immense help to doctors to log blood sugar levels for their patients, so that they can conveniently refer to recorded information each time the patient visits the clinic. The Blood Sugar Chart Template for Excel can be used with Excel 2003 or later versions, including; Excel 2007, 2010 and 2013.