A Brief Introduction to Diagrammatic Presentations
In order to represent data effectively, one can use this advanced technique called diagrams that gives an interesting form to your Presentation. There is a saying that “A picture is worth 10,000 words” as it simplify the complicated info and allow audiences to get a better understanding.
In the current scenario, the use of diagrams is becoming more and more popular. Since, it displays results more clearly and takes a visual form for the Presentation of statistical data. The best part is that a layman can easily understand the diagrams and pictures as compared to figures.
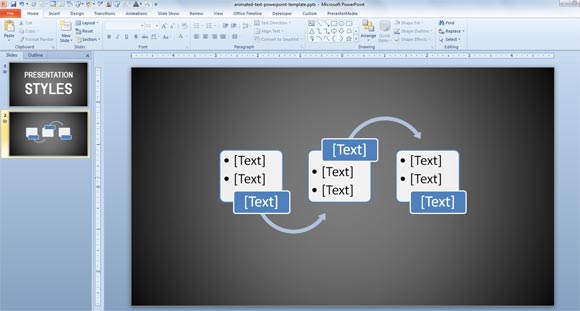
The screenshot above shows the use of alternating flows in PowerPoint using SmartArt. You can use Alternating Flow diagram for PowerPoint to show groups of information or sequential steps in a task, process, or workflow. Emphasizes the interaction or relationships among the groups of information.
Significance of Diagrams
Averages, ratios, percentages reduce the complexity into a simplified figure and makes it easier for the people to understand the importance of information. Therefore, Diagrams play an important role and here are some reasons:
Makes data simple
Undoubtedly, the diagrams render the whole data readily understandable and can be remembered easily in a best possible way. No doubt that when figures are put in the media of diagram, they tend to be clear cut.
Saves Labor & Time
Not much money is required to prepare good diagrams and so it’s quite economical as well. It actually save a lot of time and allow one to draw meaningful facts and figures.
Easy Comparison
In absolute figures, comparisons may not be clear but when it comes to talk about Diagrammatic Presentation, well it tell comparison between two or more sets of data.
Guidelines for a Diagrammatic Presentation
In the words of M.J. Moroney, the author of Facts and Figures “Diagrams register a meaningful impression almost before we think”. Therefore, Diagrammatic Presentations are the best way to communicate with your audience in a proper way. Glance at some of the guidelines that will help you in delivering perfect Presentation:
- In each diagram, the size of paper must be taken care of and when it comes to talk about the scale, well it must not be too small or big. Otherwise, it may not convey the meaning and look worthless.
- There should be no overwriting and vagueness on the diagram. The diagrams have to be absolutely neat and clean to convey the meaning simply.
- It must indicate source, nature and place of data presented. Overall it should be self explanatory.
- To make the presentation more impressive or attractive, accuracy must not be sacrificed.
Applying the diagrammatic presentation in a tactical and appropriate way, will aid in the augmentation of your presentation skills. If you need free diagrams and templates for your presentations then you can download them from FPPT.com and our partner’s websites. You can make diagrams for PowerPoint using shapes and SmartArt or download free diagram templates for presentations.
that is nice …but there are no any example of diagramatic presentation like piechart pictogram … and definition of them.