Tutorials and tips to help you create Radar Charts in PowerPoint. Radar Charts come as a default feature in PowerPoint, however, making a good looking chart is not guaranteed.
Learn all about the use of Radar Charts and how you can create them using PowerPoint. Furthermore, the posts below also teach about different types of analysis and applications tied to Radar Charts.
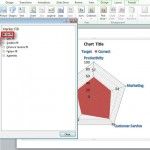
In this tutorial you will learn to make a gap analysis chart. This kind of chart is also known as a spider gap chart, spider chart, and by the name used in PowerPoint—radar chart. The gap analysis chart is great for showing the current and target strengths of something (a company, team, etc.), priorities by …
In PowerPoint you can make a development diamond PowerPoint template by using the PowerPoint radar chart. This kind of diagrams is used for example to compare countries GNP or GDP per capita. You can use this approach to assess the level of development in a given country. But higher per capita income in a country does …
Advertisement
The Latest FPPT Templates Delivered To Your Inbox
We will send you our curated collections to your email weekly. No spam, promise!