How to Make an OSI Model Diagram in PowerPoint
Last updated on April 19th, 2024
If you need to create an OSI model diagram for a PowerPoint presentation then here we will show you how to design this OSI model using shapes and SmartArt.
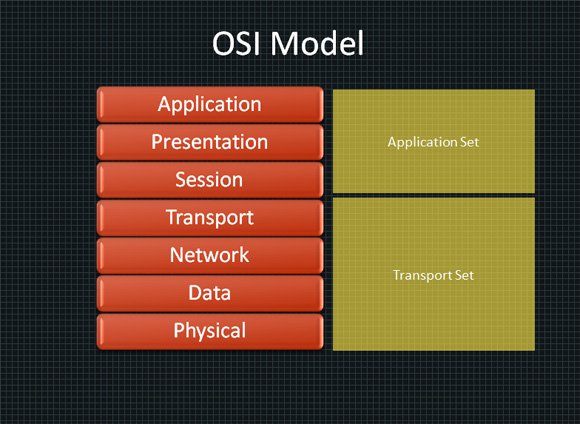
The Open Systems Interconnection (OSI) model is a product of the Open Systems Interconnection effort at the International Organization for Standardization. It is a prescription of characterizing and standardizing the functions of a communications system in terms of abstraction layers. You can learn more about OSI Model here.
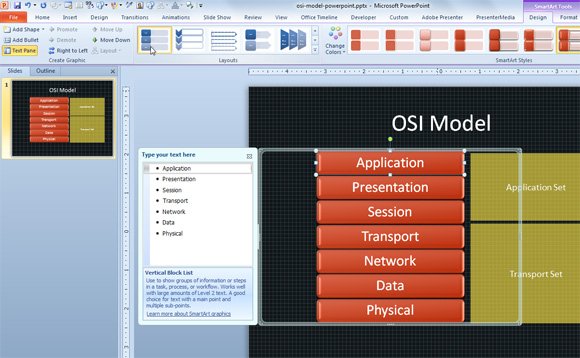
You can start creating a similar diagram using a vertical list. Fortunately PowerPoint and other versions of PowerPoint comes with nice SmartArt graphics that you can use. One of these graphics is a Vertical Block List without the secondary level.
Use Vertical Block List to show groups of information or steps in a task, process, or workflow. Works well with large amounts of Level 2 text. A good choice for text with a main point and multiple sub-points.
Under this model similar communication functions are grouped into logical layers that we can represent in a vertical list. A layer serves the layer above it and is served by the layer below it. Then you can add some additional shapes on the right to display Application Set and Transport Set. Adjust the layers accordingly.
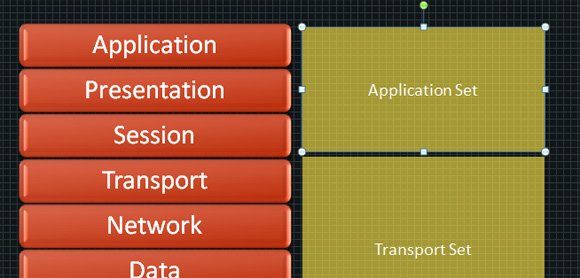
You can edit the text inside the shapes and SmartArt graphic and if you use 3D styles it is good to know that there is also an option under SmartArt Tools -> Format that lets you Edit in 2D.