How to Create a Table in PowerPoint
PowerPoint can help you to show important data and graphics simply and easily. Creating tables in PowerPoint is one of the best, and it will allow you to show a lot of information in a confined space without wasting any time or work in vain.
Step by Step – How to Create a Table in PowerPoint
The first and most basic decision you need to take is in which slide you will insert the table.
Once you have focus the attention to the slide where the table will be inserted, now we are ready to insert the table in PowerPoint.
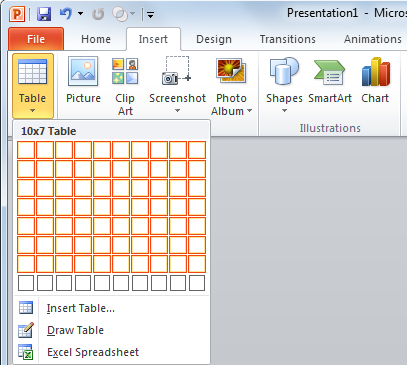
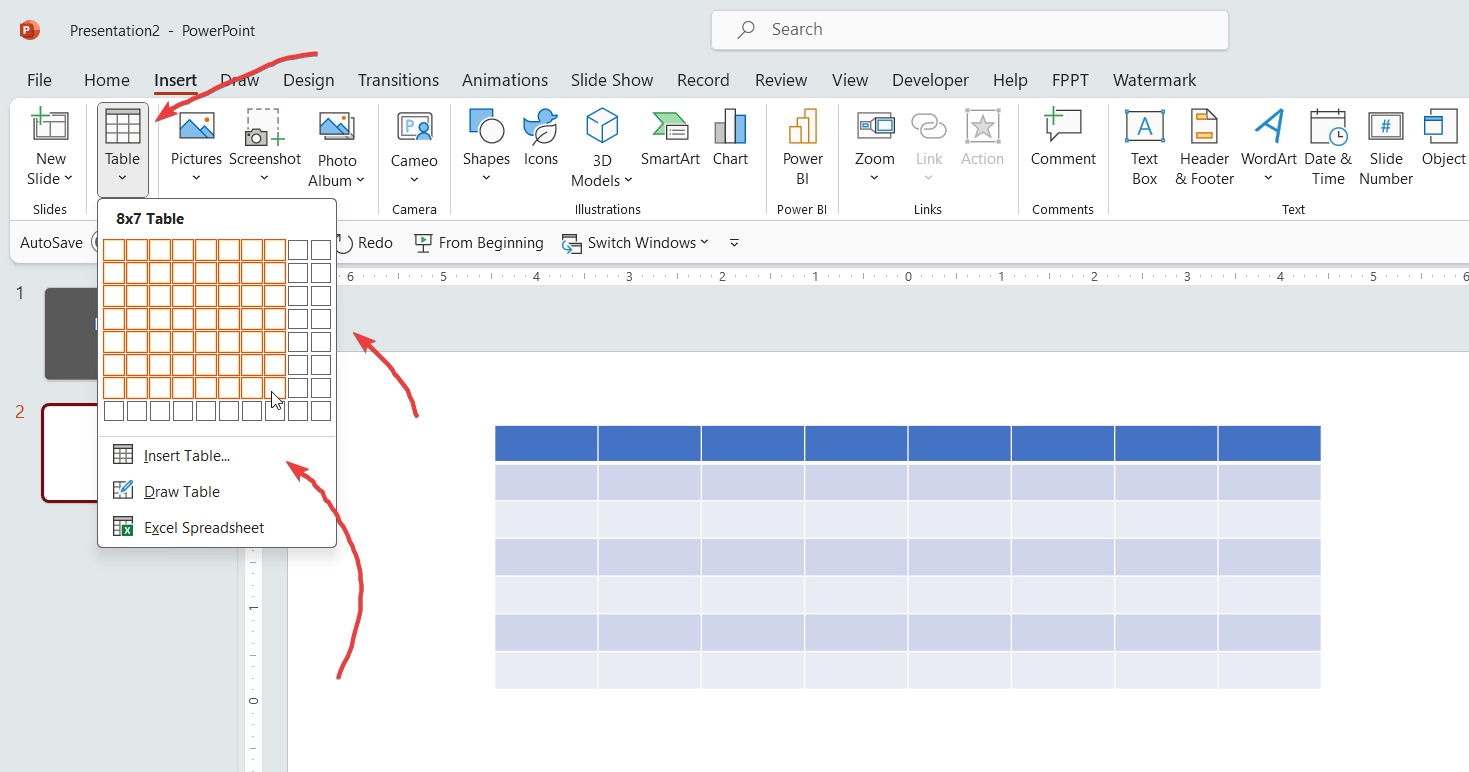
Go to Insert menu in the PowerPoint Ribbon and click on Table option. Here you will be presented with a grid where you can select the number of rows and columns for the new table to be created.
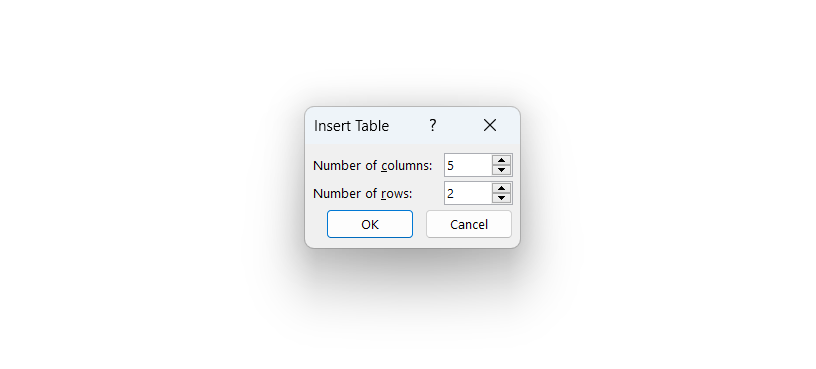
Alternatively, you can click Insert Table option to enter the number of rows and columns.
If you want to add text, click on any of the rows or columns. If you want to add another row at the end of the table, click on the last cell of the last row, and press ”TAB”.
You can always change the colour or structure of you table by choosing ”Design” tab. You will have a lot of possibilities to improve the look of you presentation.
Remember that you can add a table from Word or Excel into PowerPoint, doing a simple Copy & Paste action.
Another way of creating tables in PowerPoint is by using copy and paste. For example, if you have an Excel spreadsheet you can copy the cells there, and then go to PowerPoint and paste the Excel spreadsheet. The cells will be inserted as a table.