Download free diagrams for PowerPoint presentations and learn how to make your own custom diagrams for PowerPoint using shapes and SmartArt graphics in Microsoft PowerPoint. This category includes articles on diagrams and charts for PowerPoint where you can find simple diagrams like funnel diagram PPT templates and other more complicated diagrams like Sankey diagrams for PowerPoint or even McKinsey tables as well as other resources to download free diagram templates for presentations.
Inserting Harvey Balls in PowerPoint is easy if we have the right images and icons to insert or embed in the slide design. However the are some alternatives if we don’t have the right Harvey Balls graphics. See the recommended Harvey Balls PowerPoint templates we added recently. 1. Free Harvey Balls PowerPoint Template This is …
Fishbone is one of the most widely used methods for root cause analysis for finding a solution to a problem. If you are looking to use this technique, the chances are you will require presenting your cause and effect diagram before your subordinates, peers or senior management.
When representing computer networks, a network diagram can help represent the LAN (Local Area Network), PAN (Personal Area Network), MAN (Metropolitan Area Network), or WAN (Wide Area Network) to show a detailed architecture of the network. Making network diagrams in presentations using PowerPoint Shapes can be laborious and time consuming, however, there are a number …
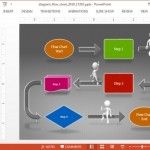
A flowchart is meant to display a task or process in a sequence. Such charts are often required for making business diagrams, models showing production processes and tasks. There are various methods by which you can create flow charts in PowerPoint, including with the help of SmartArt Graphics, shapes and readymade templates. What is a …
In PowerPoint you can make org chart and other tree graphics easily using SmartArt graphics, for example if you need to make a family tree or display data in a tree. However, in some situations it would be enough to use shapes and use lines to connect the tree. Here we will show you a …
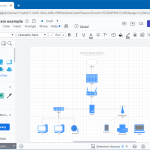
A data flow diagram is a visual representation of data flow in an information system. Data flows are an important visualization tool to model processes. You can use Data Flows to create an overview of the system which can later be elaborated just like a simple mind map diagram, or you can also use DFD …
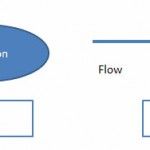
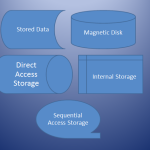
Before you start making a flowchart in PowerPoint, it is necessary to know the meaning of the various symbols that are used in it. Knowledge of these symbols is essential for presenting your chart according to the right mix of shapes. Below is an explanation for the meaning of different flowcharts symbols.
Flowcharts represent a process with the aid of symbols and arrows; each of which has a specific meaning. We previously brought you an Ultimate Guide to Making Flowcharts, which provided a range of details and tips for making flow charts. If you want a simple template for making flowcharts in PowerPoint then we have exactly …
Timelines are a great way to present a story or vast chunks of information over a long time. Through timelines, you can show milestones and other significant historical events span weeks, months, years, centuries, and even eras. However, creating timelines from scratch can take time and effort.
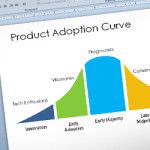
New Product Diffusion is the process by which the market accepts a new idea or new product, and it is a concept widely used in business presentations and product development. We have created a free new product adoption slide template for PowerPoint & Google Slides that you can use to display a New Product Adoption …