Charts

Learn How to Use PowerPoint Chart Layouts

PowerPoint Chart Layouts

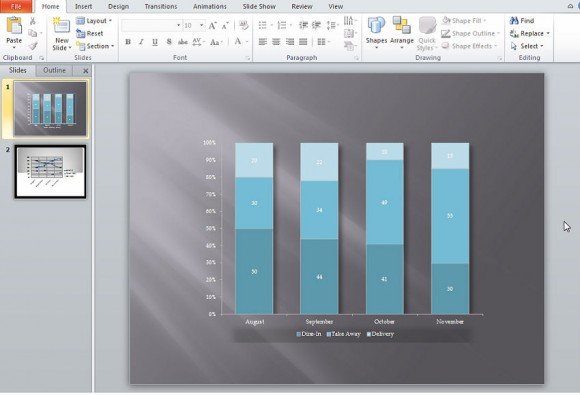
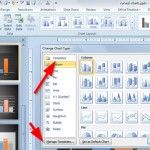
We’re going to explore the different chart layouts in Microsoft PowerPoint 2010. Now we’ll need our chart or page opened to work on. Here we already have a chart made for this tutorial, so you might want to get your own chart or one to practice with ready. Notice in the image above that there is nothing …

Waterfall Chart in PowerPoint 2010

The Waterfall Chart is a nice chart that helps to illustrate the change. This kind of chart is very effective and intuitive to use in PowerPoint presentations in order to show the total change along a breakdown of the individual components that have driven a change. Unfortunately PowerPoint didn’t come with this chart type in their …

Creately: Create Attractive Charts With Real Time Diagram Collaboration

Creating flowcharts, complex diagrams and presentations no longer requires MS Office applications like PowerPoint and Excel, since one can easily create any kind of diagram by using ready-made templates offered by web services. In previous posts we reviewed a few such services including Gliffy, Cacoo and Lucid Chart. Creately is another useful web service for creating …

Save Chart Templates in PowerPoint 2013

PowerPoint Chart Templates can be very useful within your organization. This feature is available in PowerPoint 2010 as we could see in How to Use Chart Templates in PowerPoint, however if you are moving to PowerPoint 2013, you will notice that Save As Template option is not available in the same Design tab that it …