How to Make a SWOT Diagram in PowerPoint with SmartArt
Last updated on March 29th, 2024
There are lot of diagram designs that we can purchase and download from stock images, but if we are interested to make our own SWOT diagram in PowerPoint then we can use the powerful SmartArt and Shapes feature to design it. Then we can apply some nice styles and effects to make it awesome.
In this article, we will show you how to make a SWOT SmartArt diagram in PowerPoint so you can use in your marketing plans and business presentations.
First, it is important to understand what a SWOT diagram is, and how to conduct a SWOT Analysis in a presentation. We have dedicated article for that purpose, we do won’t enter into these details.
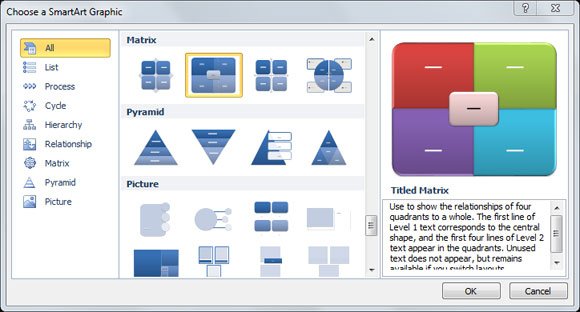
To make a SWOT Diagram with SmartArt in PowerPoint, you need to open a blank PowerPoint and then browse the SmartArt gallery to choose the SmartArt graphic that best fit this need.
There are many diagram designs that we can use to make a SWOT diagram with SmartArt. While a SWOT Diagram can be created with a simple PowerPoint table or shapes, the advantage of using SmartArt is that we can easily populate the content and customize it as per our needs, and editing a simple and intuitive grid or matrix view.
The Titled Matrix graphic in SmartArt is a good choice for this purpose. It is intended to be used to show the relationships of four quadrants to a whole. The first line of Level 1 text corresponds to the central shape, and the first four lines of Level 2 text appear in the quadrants. Unused text does not appear, but remains available if you switch layouts.
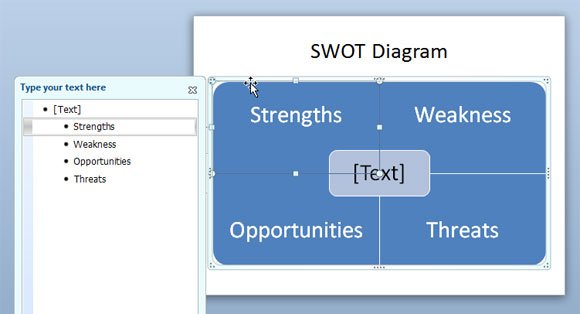
We can use the Titled Matrix graphic in SmartArt to make a SWOT diagram in PowerPoint.
When we insert the matrix in the slide, we are ready to fill each of the quadrants of the SWOT Analysis: Strengths, Weaknesses, Opportunities, and Threats. Don’t worry for the format, we can change it in a later step.
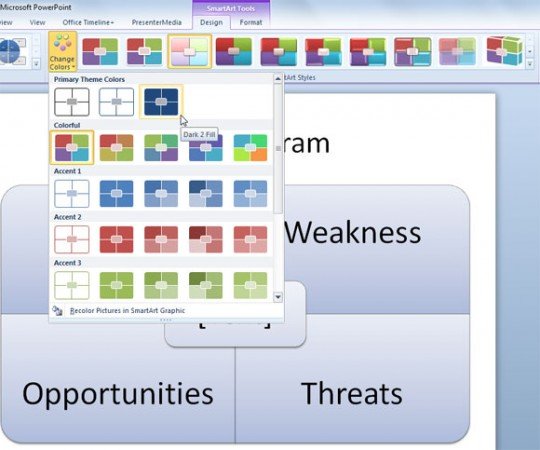
Alternatively, you can change the quadrant colors to match different colors for each element in the SWOT diagram. We will show you in this image how we can replace the colors by clicking on Change Colors and SmartArt Styles. Recolor Pictures in SmartArt Gallery will recolor the examples that you see in the gallery, which is helpful to see a preview how it will look before you apply the styles. However, remember that you can play with every new style and experiment how it will look, if you finally don’t like how it look then you can Undo changes in PowerPoint.
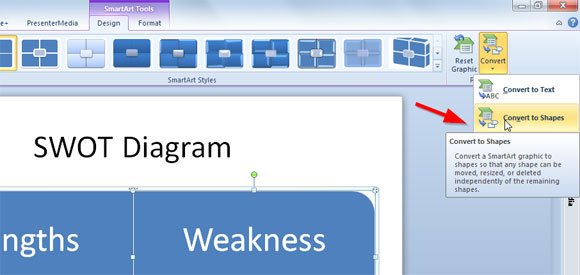
As we said earlier, we will change the format and effects. You can for example remove the central text, but before we do this we need to convert the SmartArt graphic to simple shapes. We already explained how to do it in our other article How to convert Smart Art to Shapes using SmartArt like a Pro. But here is the quick tip: To convert the SmartArt Graphic to Shapes you need to click on the Convert to Shapes button which is located under the Design menu.
Finally, applying some additional changes and effects you can get a nice SWOT diagram for free using PowerPoint and shapes.
To achieve the example we are showing below you need to:
- Remove the central text shape once the Smart Art graphic is converted to Shapes.
- Format the text on every quadrant and move it to the top of the text box.
- Apply the text styles like the bevel text style in PowerPoint.
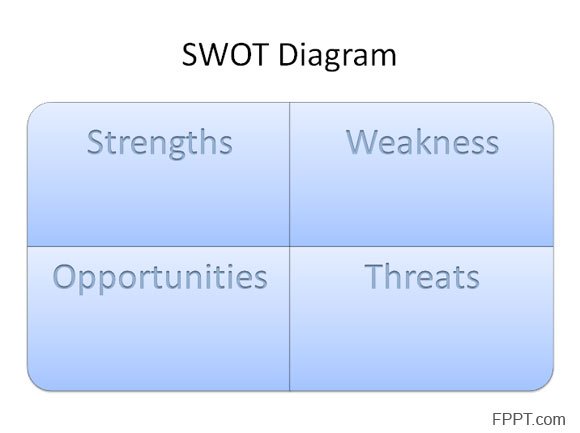
Finally, we have created a simple but effective SWOT diagram with PowerPoint SmartArt graphics.