More about Graphs in PowerPoint and Curved Edges
Recently we wrote about graphs in PowerPoint and how to make them connected with edges and vertices (nodes). Today we will show you a little more about graphs and how to make curved edges and add text to nodes. This can be really practical for PowerPoint 2010 users who need to create models using graphs and of course for Bayesian Networks or Decision models. Let’s learn more about Graphs in PowerPoint and Curved Edges.
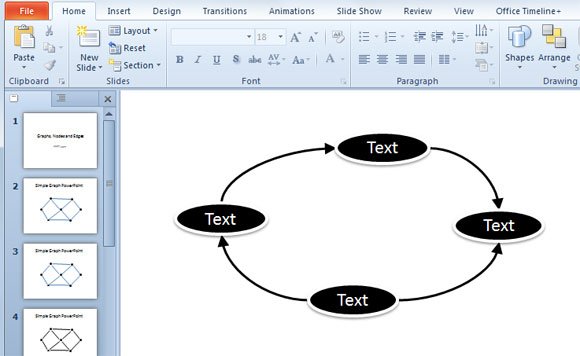
In this graph we have changed the edges to use curved lines instead of straight line. Some graphs look better using curved edges, as you can see in the picture.
The way to fix it and use curved edges instead of straight edges is by changing the connector type (edge). Using connectors in PowerPoint 2010 can help to make awesome designs and complete graphs.
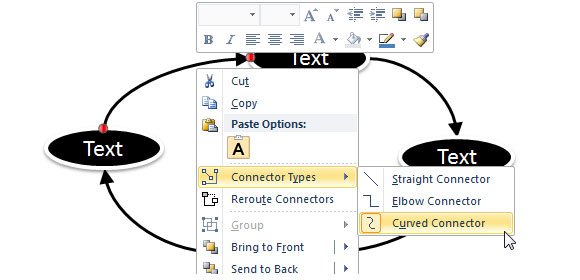
Right click over the edge and look for Connector Types. Now, choose Curved Connector instead of Straight Connector.
Repeat this same approach for other connectors (edges) in the graph and then save your changes. Using curved connectors is another way to make complete graphs in PowerPoint. But you can also use the same ideas to make other simple graphs like complete bipartite graphs, cycle graphs, connected graphs or even regular graphs.
Now you can watch this video hosted on Youtube to learn more about how to do it.