Innovative Business Graph Ideas in PowerPoint
If you are looking for innovative graph ideas to use in your business presentations then here we will try to show you some good slide designs with original charts and graphs that you can use for PowerPoint presentations.
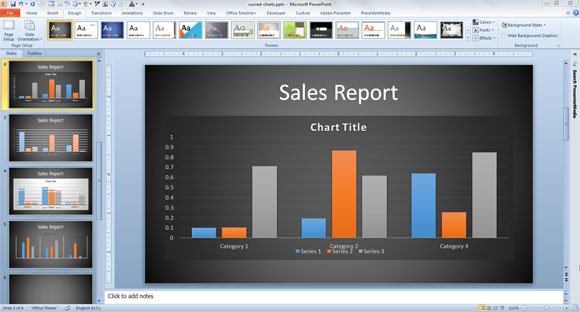
The traditional charts may look boring in some presentations, especially for an audience that is tired after having lot of meetings and watching other presentations so if you we can catch their attention with original chart ideas then that will help to make an effective PowerPoint presentation. Of course we’d need to pay close attention to the data itself since beside the graph ideas or graph design it is important to have an accurate chart.
We already wrote about how to modernize your charts in PowerPoint presentations so they can look as in PowerPoint 2013, but you can also apply other ideas to make innovative business graphs.
Learn more about innovative Business Graph Ideas in PowerPoint.
The Graphs
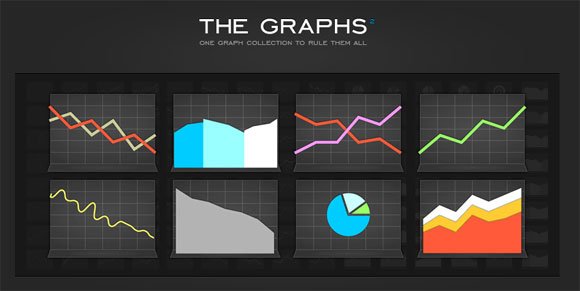
The Graph – Graph Nicer2 contains more than 160 High Quality Graph Presets available in vector format as SVG or AI. You can use these graphs to get some inspiration and make original slide designs with business charts. The Graphs 2 consists of 36 unique graph designs and many different variations. The complete 169 presets offer excellent initial choice.
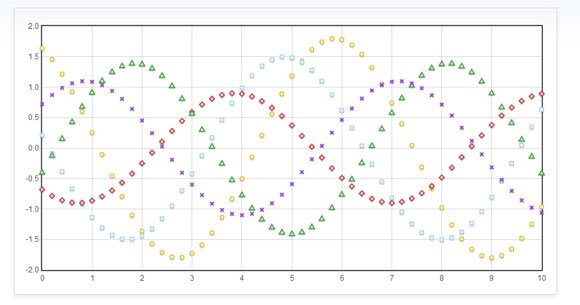
Flot
You can check the Flot examples page to see more examples of animated charts and graphs. This library is not for PowerPoint but again, you can get useful ideas to make original charts for your presentations.
To customize your charts in PowerPoint you have different options. You can manually adjust the look and feel of the charts or adjust the chart properties or if you have a chart designer then can copy and paste from other programs, for example from MS Excel.
Related:
Alternatively you can create a custom chart template in PowerPoint 2010 and 2013. To create a custom chart in PowerPoint 2010 you will need to insert a chart from the Chart gallery. You can do this from Insert tab and then Illustrations section and click on Chart. Here, choose the chart type that best fit your needs.
![]()
If you need to highlight important areas of a PowerPoint chart, then you can download free arrow template toolkit containing different arrow styles (curved, sexy arrows, straight arrows, and more). For example, you can highlight the Stacked Area chart like in this example above.
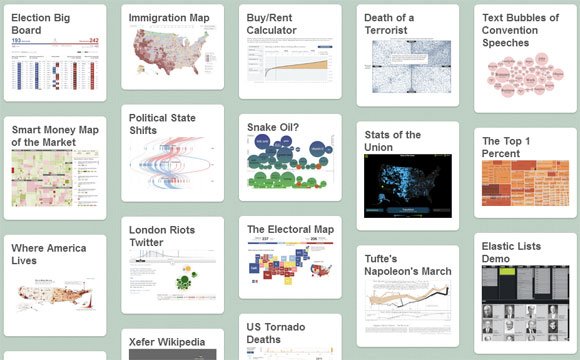
Moving a step forward, you can get more ideas from sites like Juice Labs and visualizations that they like. This website contains a nice repository of charts and visualization tools to explain data in different ways including network diagrams, map charts, timeline charts for PowerPoint, Infographic charts, Hierarchy charts and many other examples.
Another business chart ideas and 3D chart designs for PowerPoint can be found here. For example, you can learn how to plot Math functions in PowerPoint to be used for your lectures, or even create complex financial charts, business graphs for PowerPoint or professional data chart for presentations.