How to Make A Simple Spiral Diagram in PowerPoint 2010 using Shapes
Spiral charts and Spiral diagrams can help to describe processes and concepts in PowerPoint presentations. But designing such diagrams usually require lot of time or we end purchasing premium templates from websites offering PowerPoint templates and diagrams. But we can simply design the diagram using basic techniques that combines the use of shapes and styles.
Here we will show you how to make a simple spiral diagram and spiral chart in PowerPoint that we can use in our presentations. We will use shapes and apply some simple effects and styles to the shapes to make this diagram.
Design the initial shape for the Spiral Diagram
First, we start designing a simple trapezium shape in PowerPoint.
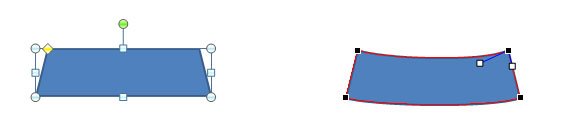
Editing the anchor points we can convert the edges of the trapezium to curves so this will help to represent the spiral. Make sure to right click on the shape and then click on Edit Points. Now you can select the top and bottom edge and right click again to choose Curved Segment. If you need help to convert a straight shape segment to curved segment we have lot of other articles explaining how to do it.
You can copy and paste this multiple times and then use the useful tip to apply format painter multiple times.

Create the front of spiral diagram
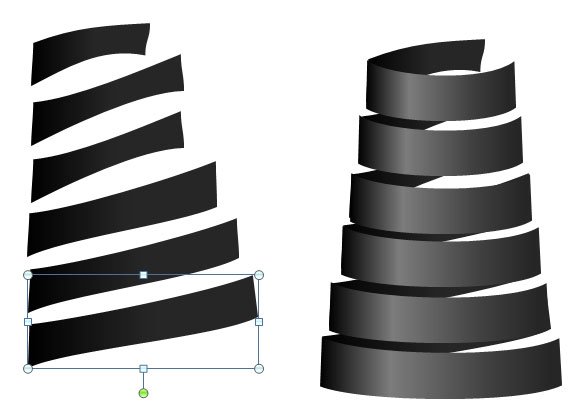
Now, you can replicate the shape multiple times. A quick tip for this is to keep the CTRL key pressed while you drag the shape to another position. Repeat this multiple times and reduce the shapes size to achieve the following design.

Create the back side
Now, you can add the shapes on the back of this spiral diagram. Below you have an example showing how these additional shapes will look. Of course you will need to match this to the previous shapes and move the shapes to the back.
Wrap up and get the spiral diagram
Then we are ready to wrap up the diagram and get this nice spiral chart in PowerPoint. You can add labels and text boxes around the spiral diagram to describe a process or other ideas.

By using spiral charts you can give an overview of processes and operations briefly. It has a cyclic movement and you can use this to describe processes like supply chain in business presentations or show the gradual growth in market share. The slide design is also good to show the expansion of the products and services in a business. The curly design is very nice to show timelines and operational tactics year by year. Lastly, this design can also be compared with a pyramid diagram like the one we used to represent Maslow’s Hierarchy of Needs PPT.