How to Make a PEST Diagram in PowerPoint
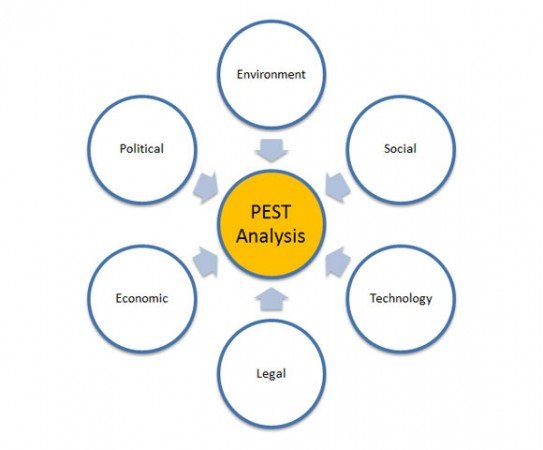
PEST Analysis is usually represented by a diagram with a central spot and arrows pointing towards the center of a circle. This kind of diagrams and representations are used to show the
This tool is widely used to help understand the big picture in certain environments for example Political, Economic Socio-Cultural and Technological environment you are operating in. In business, leaders use PEST to understand the vision of the future for the organization and share this vision to the company employees.
It is important for these reasons: Effective use of PEST Analysis can contribute positively to the organization and ensure that what you are doing is aligned positively with the forces of change that are affecting our world and the corporate strategy. If you are planning an organizational change then this analysis can help positively to that change.
Actions taken based on the PEST analysis can also be aligned with the organization vision and change, so PEST can also contribute in this way.
When operating in a new location (country or region), the use of PEST analysis can help to break some invalid assumptions and preconception and adapt to the realities of the new environment.
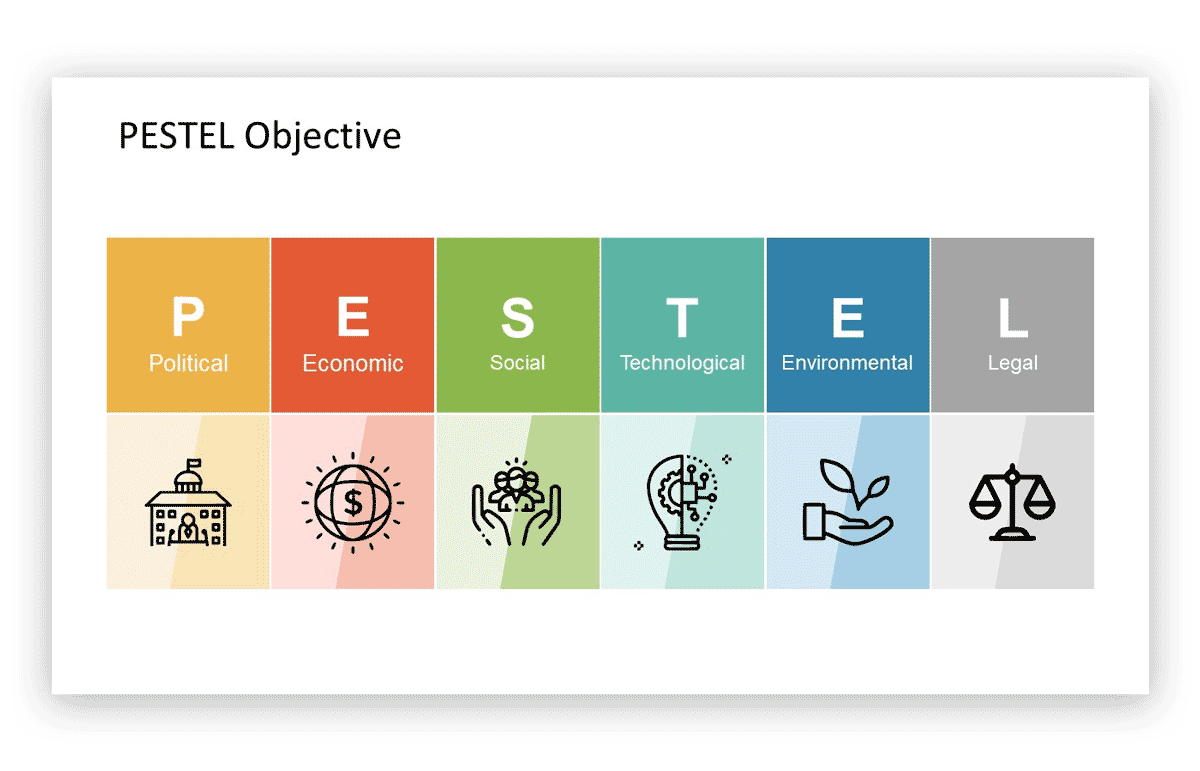
PEST is a very simple tool that stands for Political, Economic, Socio-Cultural and Technological. Many businessmen and analysts uses the term PESTAL. PEST Analysis is also widely adopted in MBA courses especially those related to corporate strategy.
If you are doing a business PowerPoint presentation and need to embed a PEST Diagram in your charts, then here we will show you how to make one. You can also download PEST PowerPoint template to decorate your presentations.
The stage process behind this tool involves:
- Make a brainstorming of the relevant factors that apply to you organization
- Identify the information associated with these factors.
- Summarize with your own conclusions about this information
Political factor can involve topics like Government type and stability, Freedom of press, rule of law and levels of bureaucracy and corruption, Regulation and de-regulation trends, Social and employment legislation, Tax policy, and trade and tariff controls, Environmental and consumer-protection legislation and likely changes in the political environment.
Also, PEST Analysis can support other analysis like SWOT, TOWS analysis, Core Competence Analysis, Value Chain Analysis, Porter’s Five Forces, Porter’s Generic Strategies, Bowman’s Strategy Clock, Scenario Analysis, Stage of business cycle
Socio-Cultural factors can involve population growth rate and age profile, population health, education and social mobility, and attitudes to these, population employment patterns, job market freedom and attitudes to work, press attitudes, public opinion, social attitudes and social taboos, lifestyle choices and attitudes to these, socio-cultural changes.
Technological Environment involves topics like impact of emerging technologies, impact of Internet, reduction in communications costs and increased remote working,
Research & Development activity, Impact of technology transfer.
Make a PEST Diagram in PowerPoint
To make PEST Diagram or chart in PowerPoint we can use SmartArt graphics, which are very helpful to add simple circular diagrams in PowerPoint. Additionally, we can convert SmartArt to Shapes and this will add more flexibility to control the diagram shapes and options.
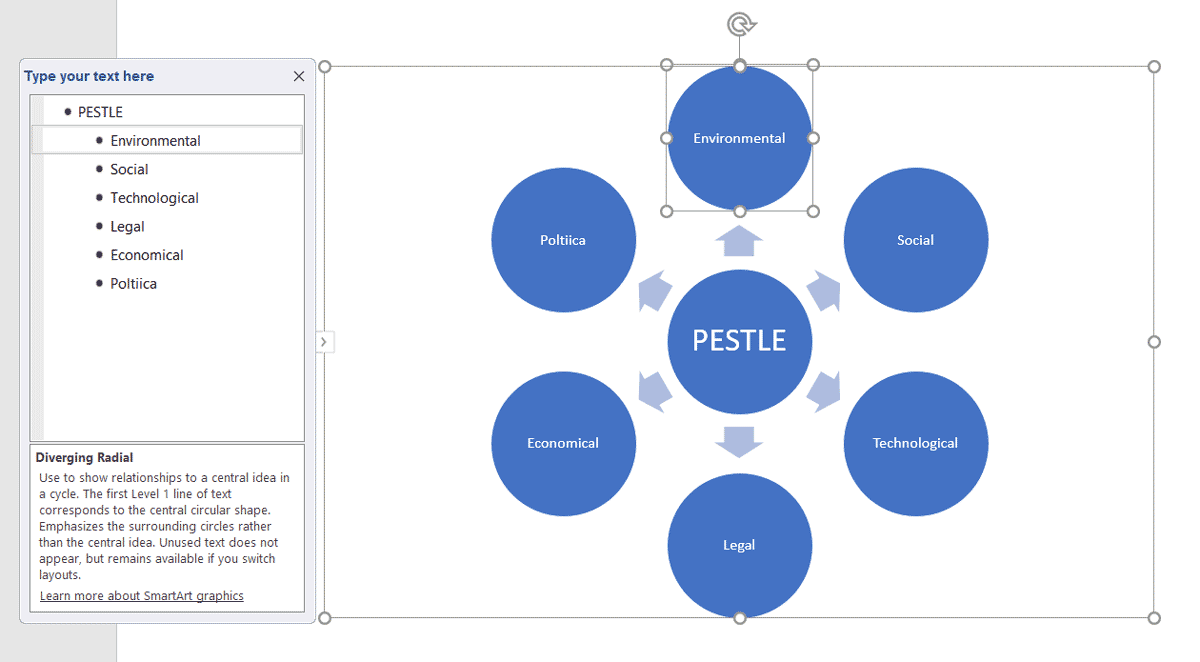
For the purpose of this diagram, we can use the Diverging Radial Smart Art graphic available in the SmartArt collection.
Use Diverging Radial to show relationships to a central idea in a cycle. The first Level 1 line of text corresponds to the central circular shape. Emphasizes the surrounding circles rather than the central idea. Unused text does not appear, but remains available if you switch layouts.
We start adding the new free graphic in PowerPoint and then add the text for each stage. As you can see, there are some notorious stages Environment, Social, Technology, Legal, Economic, Political. Make sure to put PEST Analysis in the top of hierarchy.
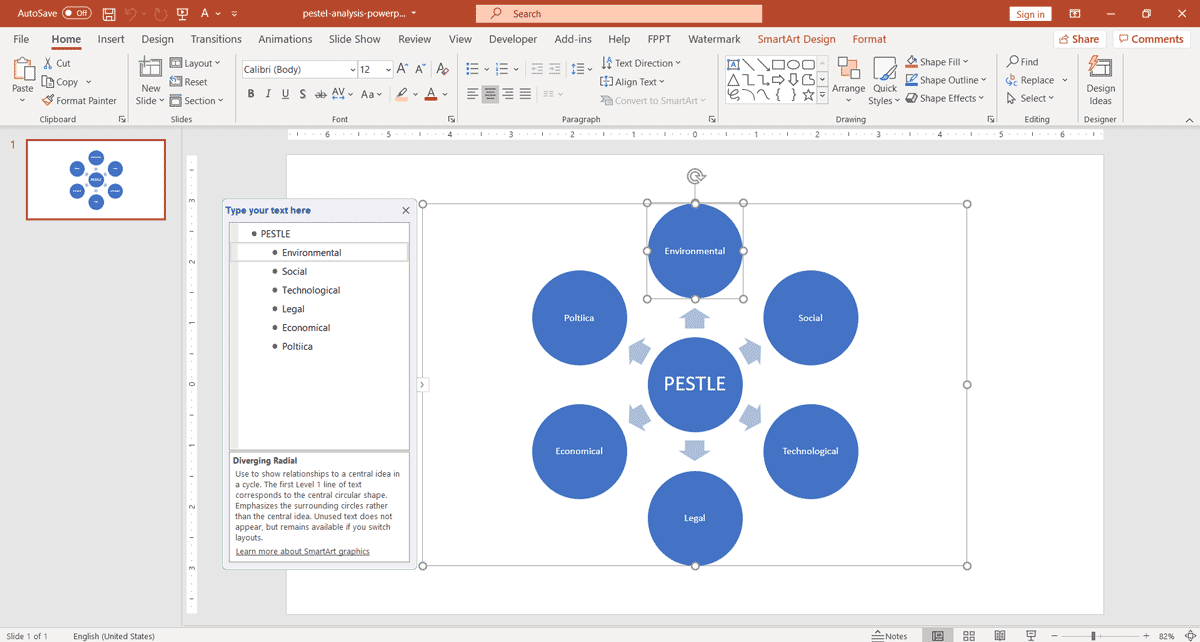
Then you can change the SmartArt styles to use another different design or even convert your 2D diagram to 3D PEST Analysis template.
PEST, PESTEL, PESTLE PowerPoint Templates
If you are looking for professional PESTLE PowerPoint templates and slide designs, you can rely on some of the following presentation designs created by professional slide template providers.
Animated PESTLE PowerPoint template
This PESTLE PowerPoint template allows a company to present and understand the basics required to conduct the PESTLE analysis onto the environment. PESTLE technique is part of an external analysis and can be used in presentations on strategy and consultancy when doing a market research, giving an overview of the different macro-environment factors to be taken into consideration, like the Environmental factor, the Technical factors, the Political factors and more.
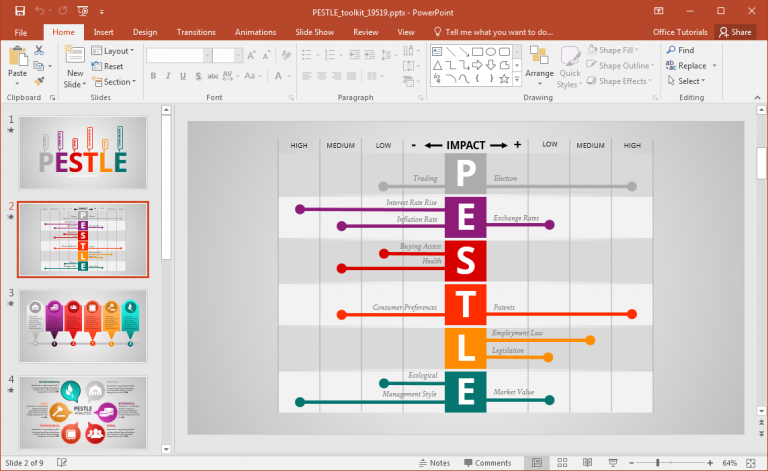
PESTLE PowerPoint template
This alternative PESTLE PowerPoint template can help you to present and conduct a PESTLE Analysis in your company. It contains the different factors and key components of a PESTLE Analysis with editable text placeholders.
One comment on “How to Make a PEST Diagram in PowerPoint”
Comments are closed.