How to Create Radial Bar Charts in Excel
These days, there are many fun, vibrant and creative ways to visualize your data. Beyond the usual bar, line, and pie charts, there are many add-ins that can help you spruce up your data and related reports. One of these is the Radial Bar Chart add-in for Excel.
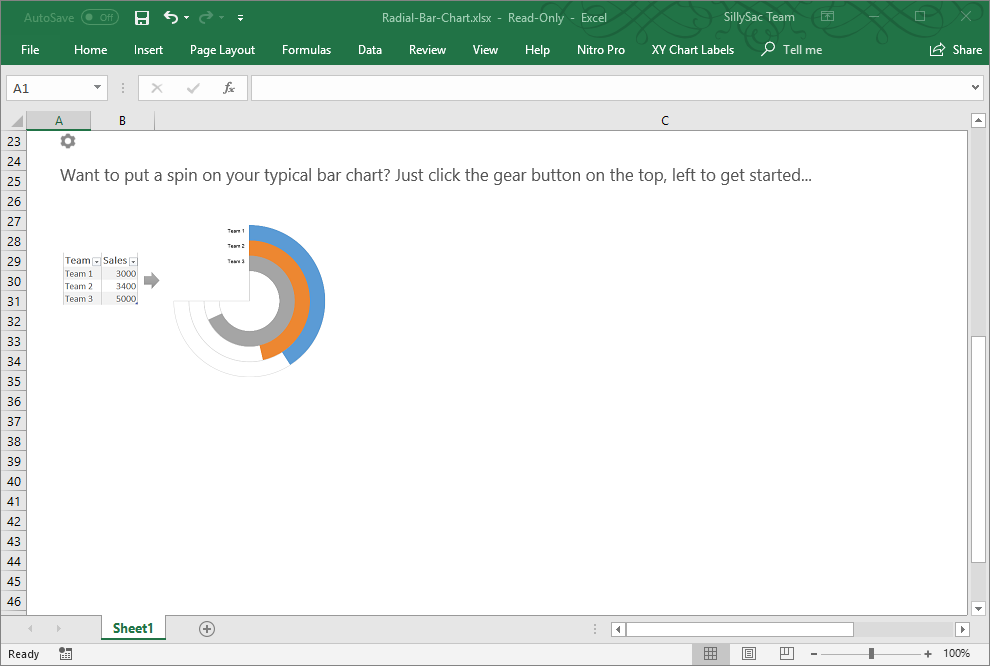
The Radial Bar Chart add-in by Keyur Patel is a very colorful radial bar chart app that you can use within Excel. It can help you make your data interesting and eye-catching. Still, you can be confident that you’re displaying your data accurately and in a way that can allow you or your audience to identify trends and analyze the information clearly.
Clearly Visualize Data and Relationships in Excel
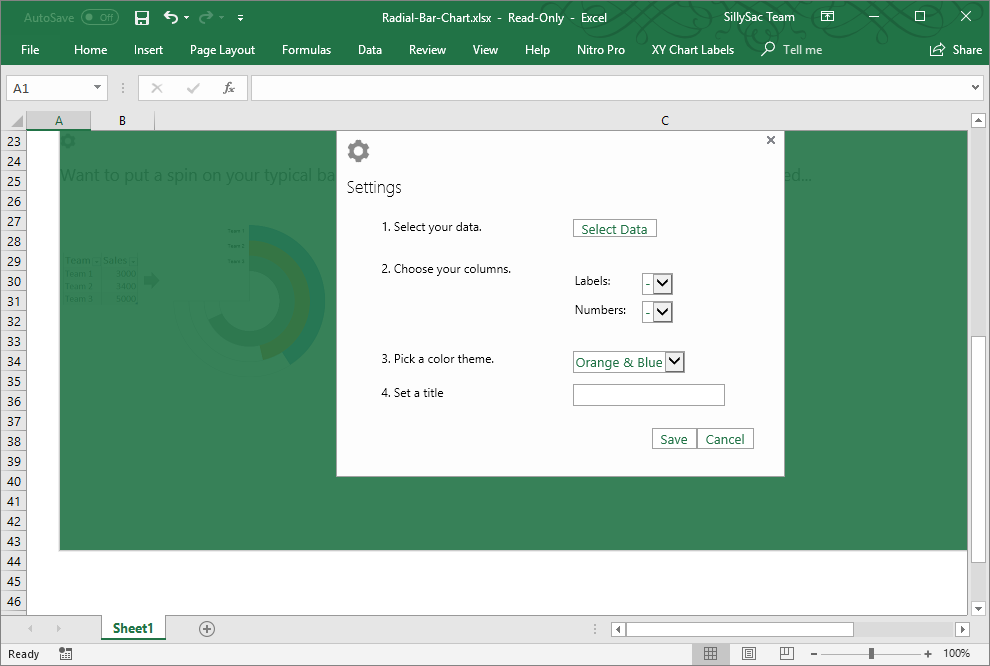
Having the Radial Bar Chart provides you with a clear-cut representation of various aspects and values related to your selected data set in Excel. The vibrant colors allow you to differentiate one information from the other. Furthermore, the look of your Radial Bar Chart can be easily customized to suit your brand, color scheme, or simply your preference. The add-in is very easy to use and best of all, you don’t have to go outside Excel to get these done.
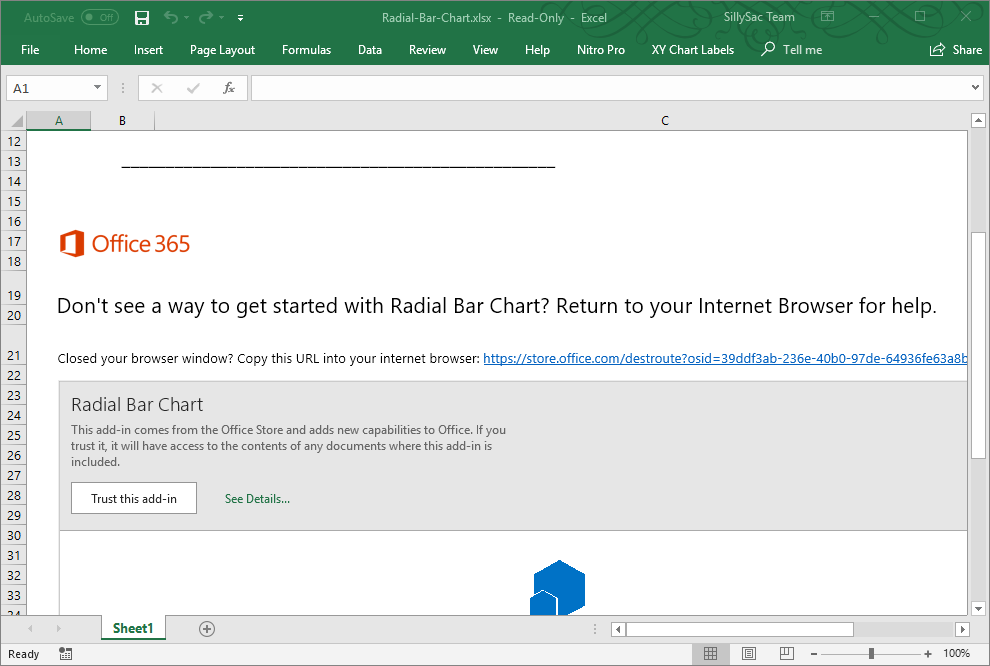
All you have to do is to download the Radial Bar Chart from the Microsoft AppSource. You just have to login with your Microsoft account and access a wide range of add-ins to extend the functionality of your Office programs, in this case, Excel.
In the AppSource portal, you can go over the wide range of add-in offerings in the categories section. You can also search for the specific add-in or keyword in the search bar for faster results.
You can also download the add-in within Excel so you don’t have to leave your program or be distracted from your work. You don’t have to download a separate program or subscribe to anything. The workflow is seamless, allowing you more efficiency so you can focus on what really needs to be done. Furthermore, you can work seamlessly as well across all devices. This is because all you have to do is to download your desired add-ins only once in one device, and as long as all your other devices are logged in with your Microsoft credentials, they will all be synced. This means you don’t have to keep installing every add-in on every device and run the risk of losing track of your important add-ins, therefore disrupting your work and making you even less productive.
Visualize Date Clearly and Creatively
With the help of the Radial Chart add-in for Excel, you can create great-looking data visualizations that represent how each item relates to the whole. It can help you get better perspective on the numbers in your data, whether it relates to sales, employee performance, production, manufacturing, delivery, logistics, demographics, and many more.
Best of all, using this Radial Chart is free. There’s no need to sign up for any service or to give out your account information. After downloading and installing the add-in, you can go ahead and use it right away. You can also create as many radial charts as you want, and customize them based on your desired color scheme or your brand requirements.
You can also embed this in your PowerPoint presentations, Word documents, and other programs for reports and presentations without worrying about losing the data or disrupting its look.
This add-in is great for work or school use, allowing you to beautifully and clearly visualize your data.