Visualization Tools

Treemap Visualization

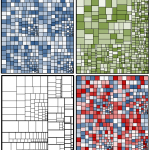
A treemap is a type of visualization that helps to see the trees behind the forest. Treemaps display hierarchical information in a series of clustered rectangles, which together represent a whole. The size of each box represents a quantity and usually are represented with colors in order to add another dimension or to represent any number of values, …

Visual.ly lets you design Infographics that you can use for presentations

Visual.ly is the world’s largest community of dataviz and infographics that let you create, explore and share infographics online. This can be a good resource for data presenters and educators to create stunning and awesome infographics for elearning or businesses. By using Visual.ly you can create stunning infographics and share online. Then you can also combine the …