3D Color Histogram
This is an example of a visualization tool that you can use to get some inspiration to make 3D histograms in PowerPoint presentations. In this case, the 3D Color Histogram will use your web cam to analyze the color information and in real time make a 3D Histogram in the browser page.
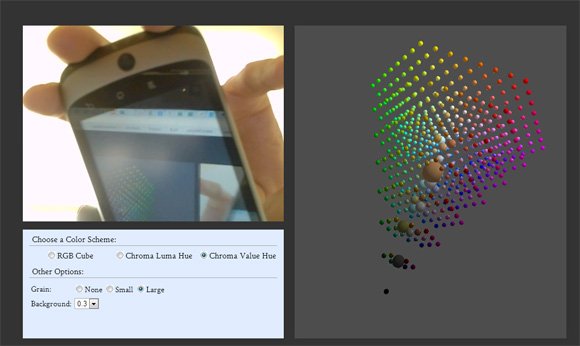
Learn more in http://shinydemos.com/3d-color-histogram/
This kind of histograms is used in image processing and photography. A color histogram is a representation of the distribution of colors in an image or video. For digital images, a color histogram represents the number of pixels that have colors in each of a fixed list of color ranges, that span the image’s color space, the set of all possible colors.
There are many other alternatives online that you can use to analyze pictures and generate an animated or navigable histogram. Then you can take screenshots using the favorite screen capture tool Greenshot and paste it in your PowerPoint presentations.
3D Histogram is another example of this kind of tools that will let you upload an image and will create a 3D visualization of the color scheme used in the image as a 3D histogram visualization. You can then copy and paste it in your PowerPoint presentations.

Learn more in http://3dhistogram.com/