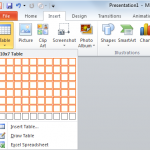
PowerPoint can help you to show important data and graphics simply and easily. Creating tables in PowerPoint is one of the best, and it will allow you to show a lot of information in a confined space without wasting any time or work in vain. Step by Step – How to Create a Table in …
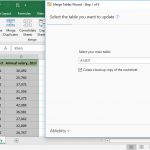
There may be times when you want to copy charts from Excel into your PowerPoint presentations. For example, if you are preparing a dashboard in PowerPoint or the annual organization report before the strategy planning. In this case, we will be interested in copying charts from Excel spreadsheets into PowerPoint. Let’s say we have the …
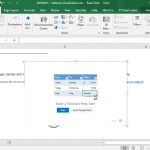
Sometimes you need to copy your data from Excel Spreadsheets to PowerPoint presentations, or not the data but the charts in order to show summarized data to the audience or show the visualizations in dashboards and reports. In order to copy the data or charts in Excel to PowerPoint, you can simply use the Copy …
In an era where information is at our fingertips, the need for efficient and effective learning models has become more crucial than ever. Among various techniques, the KWL model has emerged as a powerful tool, facilitating the learning process and aiding the retention of knowledge. This article is designed to help you understand what the …
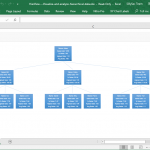
If you need to make a presentation with a stakeholders analysis then you can use Burgoyne’s model. Burgoyne provided a quantitative method in organizational research and you can model this in a PowerPoint diagram with a table where on the Y axis you can put the level of influence and the reaction to change in the …
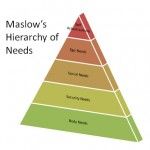
Maslow’s hierarchy of needs is a theory in psychology, proposed by Abraham Maslow in his 1943 paper A Theory of Human Motivation. Maslow subsequently extended the idea to include his observations of humans’ innate curiosity and this chart become part of any introduction to business and organizations, so often we will need to download free …
Microsoft Office programs such as Word, PowerPoint and Excel have been around for so long. They’re widely recognized and used in many business and academic activities, and considered as reliable companions in creating documents, managing data, or presenting an idea. While these programs are great in themselves, add-ins are there to make things a little …
Data management is critical in any business or organization. It’s important for people to understand and analyze data thoroughly in order to make better-informed decisions. This can also allow people, like managers, executives, and business owners, to plan appropriately based on the available data. Therefore, the information must be correct, complete, and accurate. When using …
Working with Excel spreadsheets and analyzing data as well as catching trends can be tedious and time-consuming. However, it must be done. Analyzing data is important, especially at this time when we deal with large amounts of information on a daily basis. To help you make better sense out of your data, you can use …
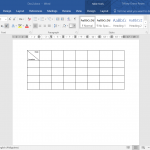
If you want to reformat your tables in Microsoft Word quickly, you can create diagonally split cells. This is a line that goes from the top of one side of the cell to the bottom of the opposite side, or the other way around. This creates a single diagonal line going across a single cell …