Download free diagram templates and slide designs that you can use in your PowerPoint presentations to decorate your slides with catchy and compelling diagrams. Our diagram templates for PowerPoint are also compatible with Open Office, Keynote and Google Slides.
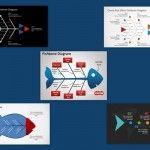
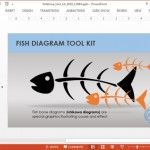
Fishbone is one of the most widely used methods for root cause analysis for finding a solution to a problem. If you are looking to use this technique, the chances are you will require presenting your cause and effect diagram before your subordinates, peers or senior management.
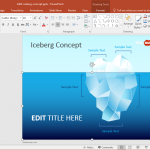
Sometimes things are so bad that what you see on top is just the tip of the iceberg. Tip of The Iceberg PowerPoint Template is a free presentation template that can be perfectly used to depict this dilemma.
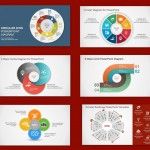
Circular diagrams are a good way of presenting information in visual form, especially processes which are cyclic in nature. Diagrams and templates which provide sample circular models are easier to edit than making your own diagrams using applications like Photoshop or PowerPoint.
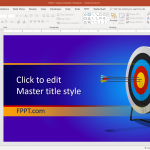
Target diagrams can be used to describe the object goals and objectives, as well as achievements during a certain period of time. We have compiled a list of our pick for the Best target Diagrams for PowerPoint. These targeting & goals templates for PowerPoint & Google Slides are designed to be easy to customize to …
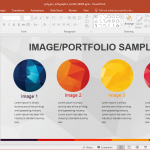
Need to make infographic slides in PowerPoint that can stand out and get noticed? You should opt for an infographic template that comes with high-quality graphics and easy to edit presentation slides. Like the Animated Polygon Infographic Template for PowerPoint.
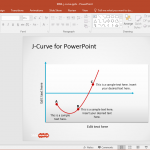
A J Curve diagram is used to represent trends for a country’s balance of trade, private equity funds, political revolutions, and even treatable symptoms for diseases. There are several reasons why you might require making a J Curve diagram, ranging from presentations for your economics class to presenting historical trends for equity funds in a …
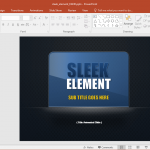
The use of sleek and shiny looking presentation templates can help you attract your audience with some visual aid. This is because glossy slides are usually quite visually appealing and therefore, they can make your content look more eye-catching. The Animated Sleek Element PowerPoint Template is a fully customizable template with sleek and shiny slide …
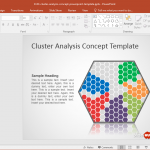
Clustering entails a process where sets of data or objects are partitioned as sub-classes that can help understand the natural structure of data set. Due to the complexity of the topics, it is hard to find good presentation templates that can help create slides to present a cluster analysis. The Free Cluster Analysis PowerPoint Template …
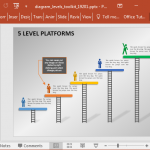
Sometimes, the best way to describe a process or a series of events is to create a diagram. Diagrams can be easier to understand if they are distributed in different stages. Unfortunately, making such diagrams from scratch can be quite difficult for many people. The Animated Diagram Levels Toolkit for PowerPoint comes with animated stage …
A Fishbone Diagram, is used for identifying cause and effect relationships. Also called an Ishikawa diagram, you might require using one to identify and determine causes related to a problem. Constructing a Fishbone diagram without a good PowerPoint template can be nothing short of a nightmare. However, what can make your presentation even more attractive …