Seasonal Sales Chart Template For Excel
As a company involved in selling products or services, your lifeblood depends on how effective your sales team is. You have to always be abreast on their performance over time and the tools they use to pitch and close a sale. However, you can’t always effectively sell your products or services, as seasons can also dictate the behavior of your customers.
The Seasonal Sales Chart Template for Excel may just as well be your best companion when it comes to determining patterns or trends when it comes to sales, season by season. This free Excel template makes use of ready-made chart and tables which make your task easy and uniform as you use the template for all your sales reporting needs as well as for including the chart into presentations.
Worksheet Tabs for Inputting and Displaying Data
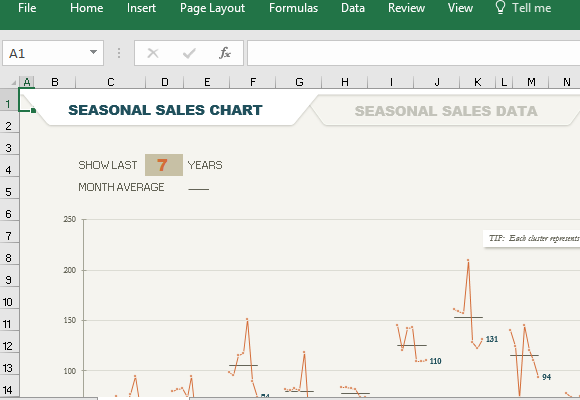
The template features two worksheet tabs, one is the Sales Chart and the other is the Sales Data. The Sales Data tab contains a table with two columns: Month and Sales. This table is very easy as you can input the different days of the month and the number of sales for each of these days. Then, the data will be automatically reflected in the Sales Chart, with the data for each month conveniently grouped together.
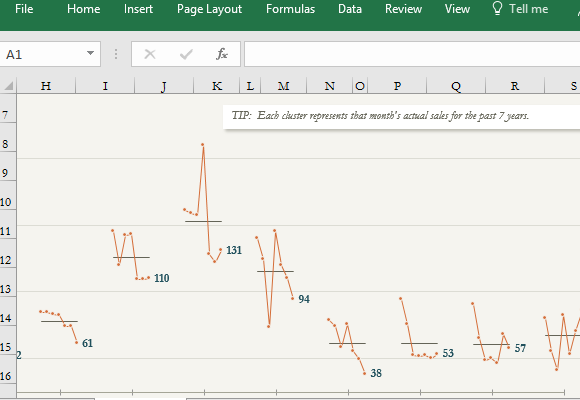
The Sales Chart features a preformatted chart that automatically generates a line graph that corresponds to the figures in the Sales Data worksheet. The months of the year are on the bottom while sales figures are on the left side of the chart.
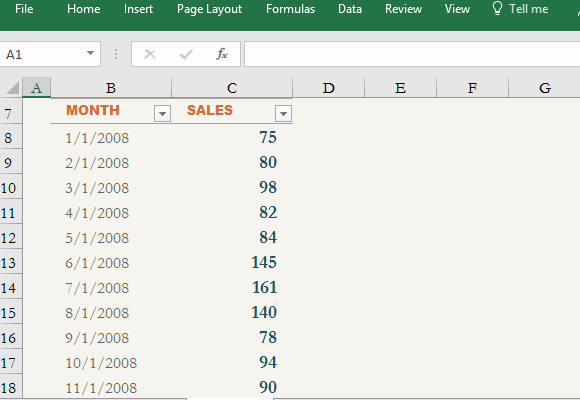
You can input your own seasonal sales figures by deleting the sample figures in the Sales Data table and typing in your own numbers. Then, you can include both table and chart into your sales report. You can also embed the chart to your presentations and other documents.
View the Seasonal Sales Trends Over the Years
What’s best about this template is that you can view the seasonal sales of your products or services for the last seven years so you can see the trends season by season.
This template is compatible with Excel 2007 and later versions.