Thermometer in PowerPoint 2010
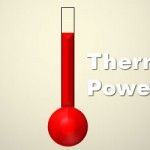
A thermometer can be a great visualization tool to be used in conjunction with gauges and other dashboard elements. However, PowerPoint by default do not include this visualization in the SmartArt Gallery or in the available charts. Here we will show you how to make a simple thermometer in PowerPoint 2010 using Shapes. This thermometer …

Make Interactive Maps with StatSilk Software

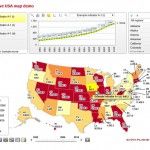
Creating Interactive Maps and impressive visualizations for presentations is something that many presenters may wonder how-to in order to impress the audience. Fortunately we can now access to StatSilk. StatSilk offers a range of web-based and desktop software to cater to diverse mapping and visualization needs including interactive maps and other data visualizations. By using StatSilk software …

Connect Arrows in PowerPoint 2010

Connecting arrows in PowerPoint 2010 can be challenging for anyone newbie who need to make graphs or diagrams. While connecting shapes is much easier since each shape has its own anchor points, connecting single arrows together can be challenging in advance. But earlier we talked about how to connect lines in PowerPoint in the article …

Designing Graphs in PowerPoint 2010

In mathematics and computer science, graph theory is the study of graphs. A Graph is a mathematical structure used to model pairwise relations between objects from a certain collection. Indeed, the tree structure representation are a type of graphs having a root and leaves. A graph is a collection of vertices (nodes) and edges that are …

Creating 3D Objects in PowerPoint 2010

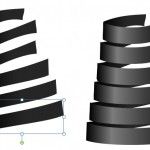
This video explains how to create 3D Objects in PowerPoint 2010 using Shapes. By using basic shapes we can get 3D objects with perspective including cylinder, prisms, and any other variant. This video will help to understand how to design 3D objects using PowerPoint and 3D Format nad 3D Rotation options in Format Shape. Alternatively …