Make Interactive Maps with StatSilk Software
Creating Interactive Maps and impressive visualizations for presentations is something that many presenters may wonder how-to in order to impress the audience. Fortunately we can now access to StatSilk. StatSilk offers a range of web-based and desktop software to cater to diverse mapping and visualization needs including interactive maps and other data visualizations. By using StatSilk software you can make data analysis easy, efficient and enjoyable. The premise behind this company is that the software should adapt to your needs, and not the other way around.
Interactive scatter plot, you can also create Stat Trends using some nice bubble interactive charts to show data.
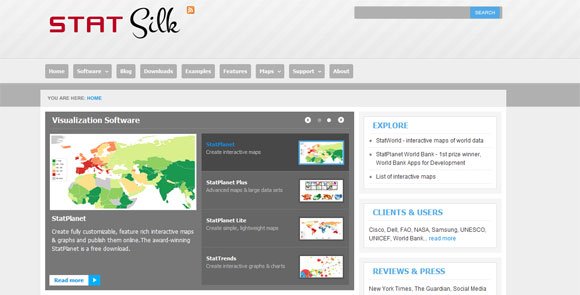
Check out the examples page http://www.statsilk.com/examples where you can see free interactive maps and charts in the web page.

The software bundle contains Interactive scatter plot example, Seychelles map of schools, Organization: Ministry of Education, Seychelles, Customization: Custom map displaying schools as map points, Human Evolution example including primate fossil finds around the world, Teacher Codes of Conduct – Map Portal, UNESCO-IIEP example, and other interactive maps from different countries in Latin America, Africa, Europe, Asia, Middle East and North America.
Additionally, you can access free resources including shapes and interactive maps. Thousands of other shapefile maps can be downloaded for free. The collection includes country shapefiles, shapefiles at province or state level, and other administrative boundaries maps. The shapefile (compatible with ESRI shapefile) format is a geospatial vector format and one of the most common (if not the most common) map format. Learn more here: http://www.statsilk.com/maps/download-free-shapefile-maps
Learn more in www.statsilk.com