Free Sales Forecast Template For Excel 2013 With Editable Logo Placeholder
For companies whose main income-generating activity is through its sales effort, a sales forecast is a very useful report to have regularly. The Free Sales Forecast Template for Excel 2013 with Editable Logo Placeholder is the perfect sales forecasting document to track sales opportunities and transactions in process.

Sales forecasting is very important in a business because it allows you or the management to project how much sales or profit you are going to earn. The Free Sales Forecast Template for Excel 2013 With editable logo placeholder will also allow you to see whether the sales efforts you have in place are effective.
Forecast Input
On a closer look, the Excel 2013 template seems complicated. However, the details are exactly what your company needs to know to make a sales forecast in terms of data and presentation.

The Free Sales Forecast Template for Excel 2013 with Editable Logo Placeholder has two tabs, the Forecast Input and the Forecast Pivot Table.
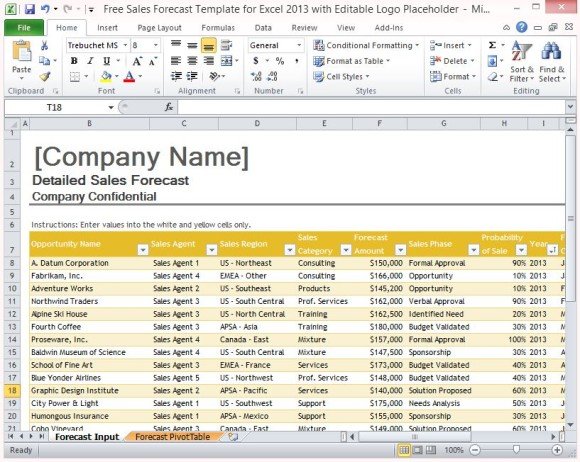
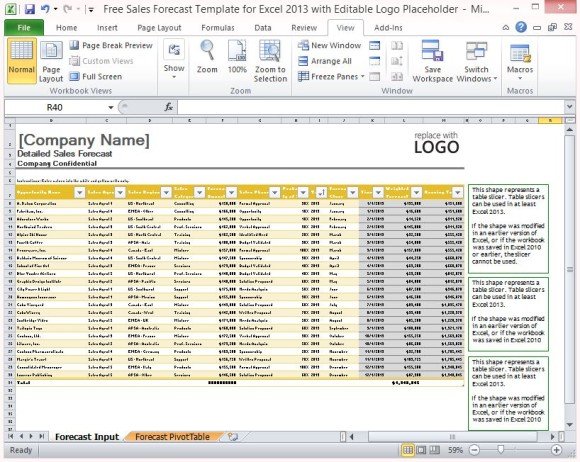
The Forecast Input is where you type in your data. This table contains Opportunity Name (your sales prospects or clients), the Sales Agent in charge, Sales Region, Sales Category, Forecast Amount, Sales Phase, Probability of Sale, Year, Forecast Close, Timeline, Weighted Forecast, and Running Total. Note that this information are crucial not only in forecasting but also in tracking your agents and in seeing which part of the sales phase each of them are undergoing.
This information is the Forecast Input, which may be helpful if you are part of the upper management, a sales supervisor, a regional manager, to name a few. This allows you to keep track of the sales, the agents, the clients, and how much your team or your company stands to earn given a particular timeline.

Forecast PivotTable
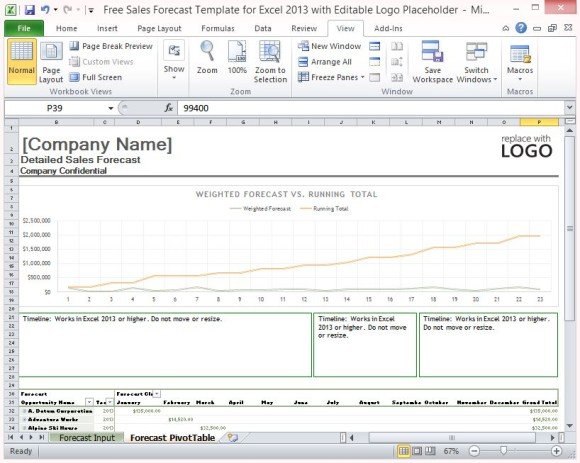
The second part of the Excel 2013 template is the Forecast PivotTable. It contains a table of the Forecasted Sales Closure and the Sales Amount per Opportunity Name. This way, you can see a “map” of sales amount through a span of time, making it easy to track and look at the figures.
The Forecast PivotTable also contains a timeline. This visually shows the Weighted Forecast against the Running Total. This Timeline works best in Excel 2013 or higher. This Weighted Forecast VS Running Total Timeline shows how the actual sales are going against the forecasted amount within a given time period.
This detailed Sales Forecast Template for Excel 2013 is easy-to-use and free. You can even embed the tables and timeline in a PowerPoint presentation if you are to make a report. You can download this Excel 2013 template from the Office portal.
