Data Flow Diagram in PowerPoint
Last updated on April 22nd, 2024
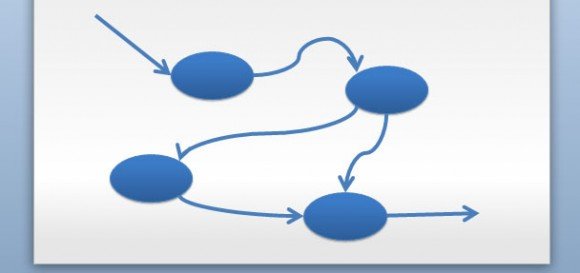
A data flow diagram is a visual representation of data flow in an information system. Data flows are an important visualization tool to model processes. You can use Data Flows to create an overview of the system which can later be elaborated just like a simple mind map diagram, or you can also use DFD PowerPoint diagrams to make awesome designs and diagrams for your presentations in PowerPoint or a structured design of data processing.
It is important to know that for data flow diagrams, we will have input and output from the system, including where the data will come from and go to and where the data will be stored. In PowerPoint we can design data flow diagrams easily using shapes. A simple data flow diagram can be modeled using shapes like in this example below.
Related articles:
- Create data flow diagram in PowerPoint
- Convert text to diagram in PowerPoint
- Funnel diagram in PowerPoint
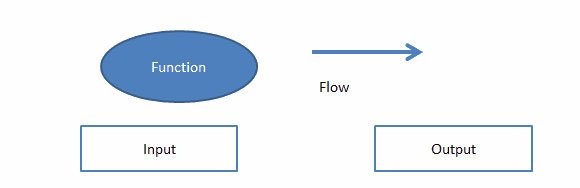
For the diagram, you can use simple shapes to model the different elements o a data flow diagram. For example, the function with an oval or circle, the flow with arrows and the inputs and outputs.
You can also use the same techniques to make control flow diagrams, data islands, dataflow diagrams, functional flow block diagrams, function models, Pipelines in PowerPoint, system context diagrams, structured analysis and design techniques, andstructured charts and activity diagrams.
It is common practice to draw the context-level data flow diagram first. On the context diagram the system’s interactions with the outside world are modeled purely in terms of data flows across the system boundary.