Advertisement
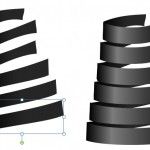
How to Make a Layered Wheel Diagram Template in PowerPoint 2010
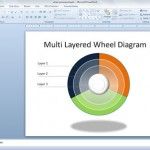
This article will explain how to design a simple but useful wheel diagram with multiple layers. You can use this kind of PowerPoint diagrams as a visualization tool for your presentation reports or dashboards, but also to combine the design with other similar visualizations like steering wheel. Let’s see how to make a wheel chart template …